


Solana (SOLUSD) Is down 1.07% on Oct 18: Key Drivers to Watch



Solana (SOLUSD) is down 1.07% at Oct 18 04:45(ET), now at $102.1, with a 7-day down of 7.48%.
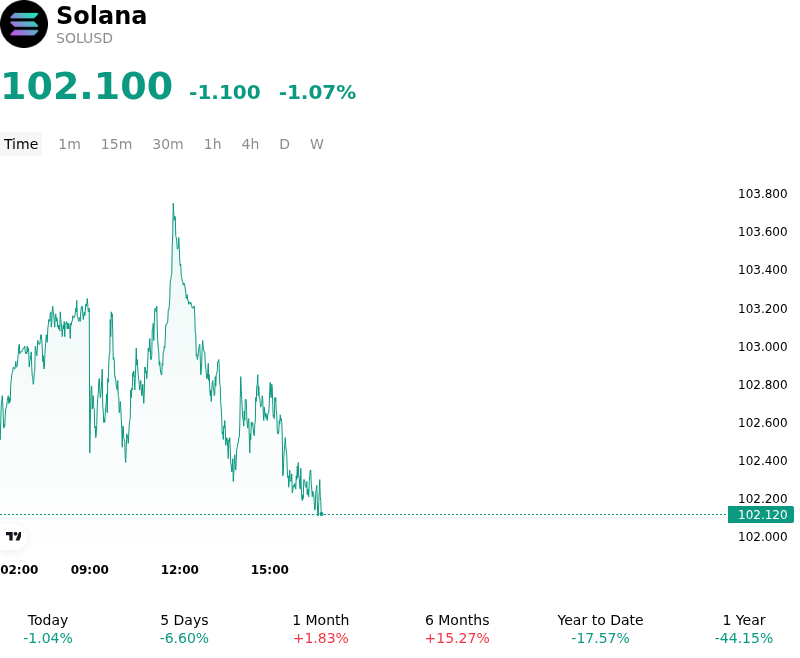
What is driving Solana (SOLUSD)’s stock price down today?
Solana pulled back as persistent institutional capital outflows and tightening on-chain liquidity weighed on market depth and buyer conviction. A primary headwind stems from sustained net redemptions across spot Solana exchange-traded funds, which recorded extended daily outflows into mid-October. This persistent institutional distribution has dampened spot demand and constrained institutional capital allocation. Simultaneously, Solana's circulating stablecoin base contracted from late-September highs, shrinking the aggregate liquidity pool depth available across decentralized exchanges. With a smaller stablecoin buffer backing decentralized trading pairs, sell orders exert a greater price impact, amplifying downside pressure and creating intraday volatility.
Derivatives positioning and technical dynamics further reinforced the consolidation. With the asset facing dense overhead resistance near short-term exponential moving averages and technical indicators signaling momentum weakness, leveraged market participants elected to trim risk. Trading volume relative to open interest reflects short-term tactical hedging and profit taking rather than aggressive long accumulation. Although fundamental network metrics—such as elevated active address counts, strong transaction throughput, and record growth in tokenized real-world assets—remain structurally supportive, investors are adopting a cautious posture ahead of major protocol milestones like the upcoming Alpenglow mainnet upgrade.
From a macro perspective, the move represents an event-driven liquidity repricing rather than a breakdown in fundamental network utility. Broader digital asset sentiment remains sensitive to global liquidity conditions and Federal Reserve interest rate expectations, keeping risk appetite constrained across high-beta layer-one tokens. Until spot ETF flows stabilize and stablecoin liquidity re-expands across the ecosystem, Solana remains prone to range-bound price action and liquidity-driven pullbacks, with market participants closely monitoring key support zones to assess institutional re-entry points.
Technical Analysis of Solana (SOLUSD)
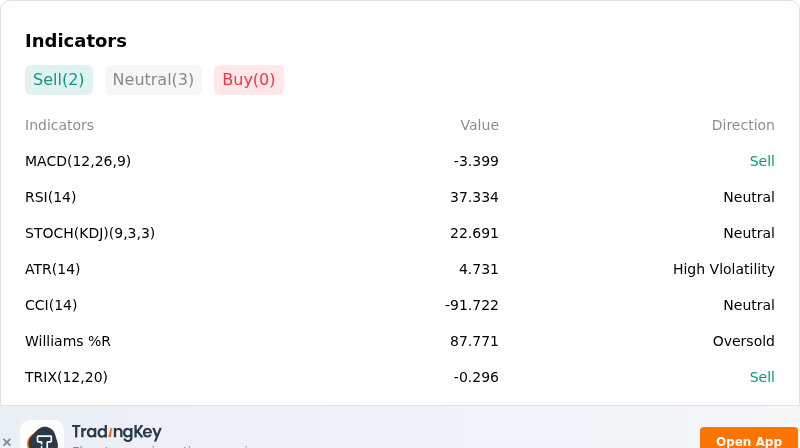
Technically, Solana (SOLUSD) shows a MACD (12,26,9) value of -3.399, indicating a sell signal. The RSI at 37.334 suggests neutral condition and the Williams %R at 87.771 suggests oversold condition. Please monitor closely.
More details about Solana (SOLUSD)
Recent Events and Risks:
- Institutional Spot ETF Redemptions: Persistent net outflows from Solana-focused spot ETFs have generated continuous overhead supply pressure, signaling reduced institutional appetite for high-beta altcoins and weakening spot market support.
- Derivatives Deleveraging and Liquidation Cascades: Technical breakdowns below key support thresholds near the $100 level have triggered significant long liquidations and a sharp drop in futures open interest, leaving SOL vulnerable to cascading sell-offs.
- Whale Unstaking and Exchange Inflows: Large-scale unstaking activities by crypto whales and subsequent transfers of tens of millions of dollars worth of SOL to exchange order books have increased circulating spot liquidity and heightened selling pressure.
- DeFi Liquidity Contraction and Volume Decay: Declining decentralized exchange (DEX) volumes and stablecoin outflows across the Solana network reflect weakening ecosystem activity, diminishing fee generation, and eroding market depth.
This article may include AI-generated content that is human-reviewed, which is for reference and general information purposes only and does not constitute investment advice.
Recommended Articles








Comments (0)
Click the $ button, enter the symbol, and select to link a stock, ETF, or other ticker.