


BNB (BNBUSD) Suddenly Goes down 1.28% on Oct 17: What You Need to Watch



BNB (BNBUSD) is down 1.28% at Oct 17 20:55(ET), now at $719.4, with a 7-day down of 3.95%.
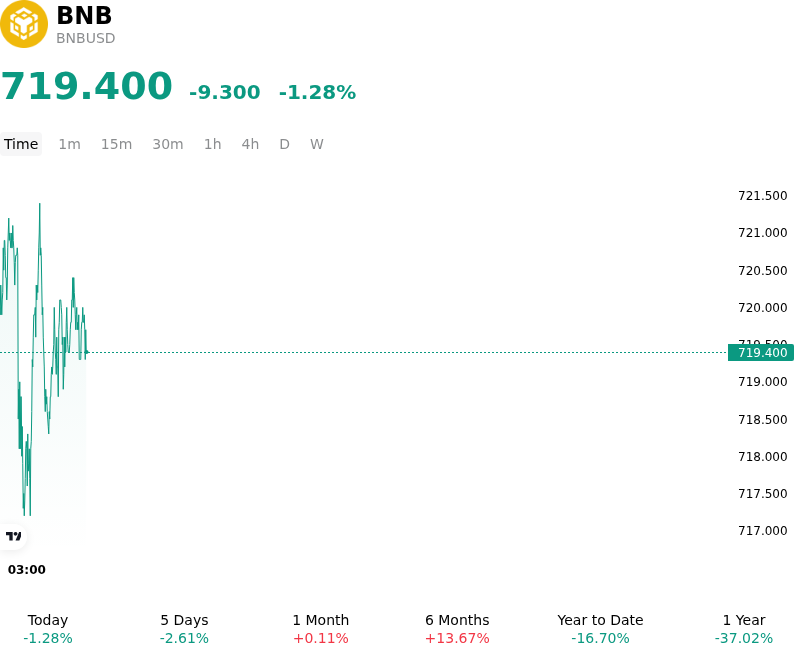
What is driving BNB (BNBUSD)’s stock price down today?
Downside pressure on BNB stems primarily from broader macroeconomic risk-off sentiment following hotter-than-expected United States inflation data, which recalibrated market expectations regarding the Federal Reserve's monetary policy path. Higher inflation prints pushed U.S. Treasury yields upward and strengthened the U.S. dollar, tightening global liquidity conditions and dampening risk appetite across digital asset markets. This macroeconomic headwind prompted capital outflows from major spot crypto products and spillover weakness from technology equities, leading to a general contraction in market-wide liquidity.
From a market structure perspective, BNB experienced technical weakness after failing to hold key short-term moving averages and pivotal support levels. The failure to sustain established pivot zones triggered automated stop-loss orders and localized long liquidations in the derivatives market. As perpetual swap funding rates normalized and speculative open interest contracted, long squeezes compounded downside momentum, forcing leveraged traders to reduce exposure amid elevated volatility.
Within the ecosystem, recent product adjustments and service streamlining by Binance highlighted a strategic re-alignment toward core exchange and high-performance Layer-1 development. While long-term structural value accrual remains supported by the automated quarterly fee-burn mechanism and scheduled throughput upgrades on the BNB Smart Chain mainnet, immediate capital flows reflect defensive institutional positioning. With traders closely watching key structural support levels, market participants remain cautious, prioritizing risk mitigation over speculative exposure until global macro liquidity conditions stabilize.
Technical Analysis of BNB (BNBUSD)
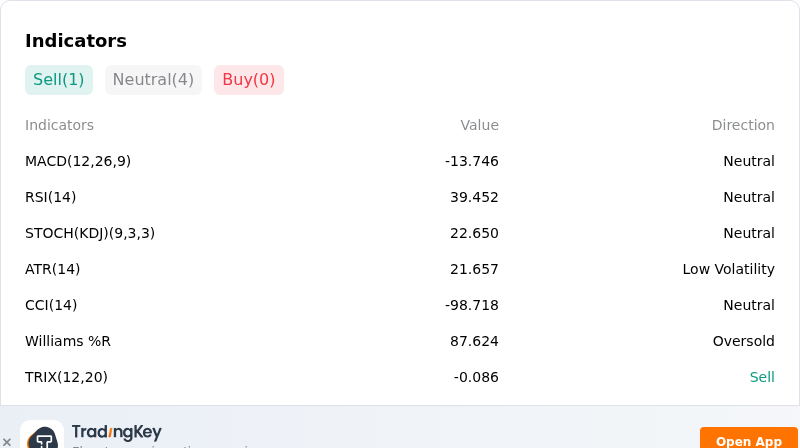
Technically, BNB (BNBUSD) shows a MACD (12,26,9) value of -13.746, indicating a neutral signal. The RSI at 39.452 suggests neutral condition and the Williams %R at 87.624 suggests oversold condition. Please monitor closely.
More details about BNB (BNBUSD)
Recent Events and Risks:
- Technical Support Breakdown and Derivatives Liquidations: BNB has slipped below key technical pivot levels around $740–$750, accelerating short-term downward momentum and triggering long-position liquidations across futures markets, leaving price action exposed to deeper support tests near $700 and $680.
- Regulatory Overhang and Compliance Risk: Ongoing global regulatory friction surrounding Binance's licensing and international compliance frameworks continues to weigh on investor sentiment, amplifying downside volatility risks for exchange-linked ecosystem tokens during periods of market stress.
- Macroeconomic Risk-Off Pressures: Resilient economic data and elevated U.S. Treasury yields have tightened global liquidity conditions, discouraging speculative risk-taking and driving capital away from major altcoins into defensive asset allocations.
- On-Chain Whale Liquidations and Spot Supply Pressure: On-chain tracking indicates localized profit-taking and large wallet transfers into exchange deposit addresses, creating immediate sell-side order book pressure following recent price rejections at higher resistance zones.
This article may include AI-generated content that is human-reviewed, which is for reference and general information purposes only and does not constitute investment advice.
Recommended Articles









Comments (0)
Click the $ button, enter the symbol, and select to link a stock, ETF, or other ticker.