


XRP (XRPUSD) Suddenly Goes down 2.55% on Oct 17: What You Need to Watch



XRP (XRPUSD) is down 2.55% at Oct 17 20:25(ET), now at $1.305, with a 7-day down of 7.32%.
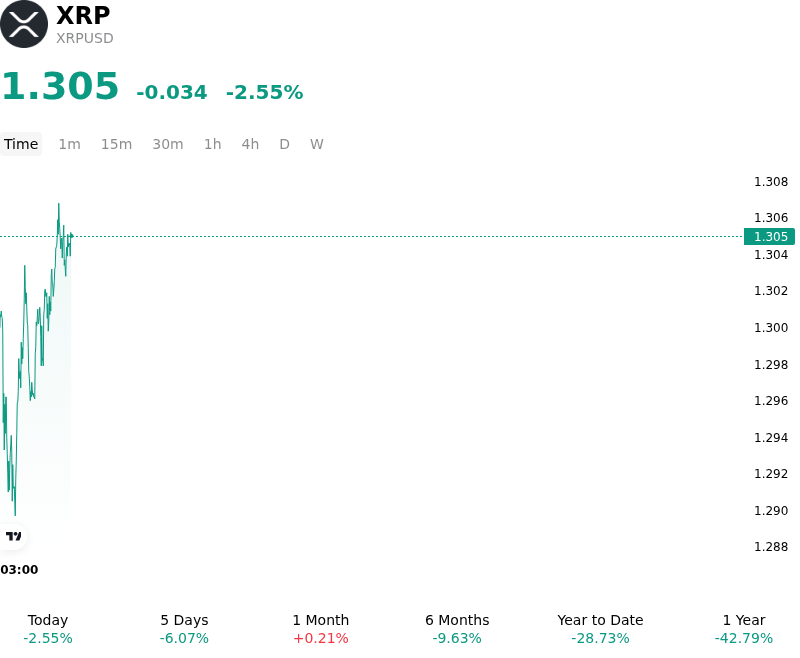
What is driving XRP (XRPUSD)’s stock price down today?
The downward pressure on XRP was primarily driven by a broader macro-driven de-risking across digital assets, spurred by persistent inflation metrics and firm U.S. Treasury yields. Market expectations for a more hawkish Federal Reserve stance leading into the upcoming policy meeting bolstered real yields, raising the opportunity cost of holding non-yielding crypto assets. As global liquidity conditions tightened, macro allocators pared back exposure across risk assets, disproportionately affecting large-cap altcoins as speculative capital rotated toward defensive cash equivalents and sovereign debt.
Asset-specific fundamentals also contributed to muted spot demand, failing to provide an immediate counterweight to macro headwinds. Recent corporate treasury developments and institutional prime brokerage rollouts heavily leveraged fiat-pegged stablecoins for transaction collateral rather than creating direct structural spot buying for the underlying token. Meanwhile, proposed protocol upgrades intended to introduce native lending mechanisms on the XRP Ledger remain contingent on validator approval thresholds, keeping near-term utility growth in a holding pattern and preventing immediate fundamentally driven capital inflows.
From a market structure and positioning perspective, the pullback was reinforced by derivatives deleveraging and technical sell stops. A breakdown below key short-term support levels triggered long liquidations in perpetual futures markets, accelerating intraday downward momentum. Although institutional spot ETF products continue to show steady long-term asset accumulation, daily net inflows were insufficient to absorb sell-side pressure from derivative market clearing and retail profit-taking. Consequently, XRP remains bound to macro liquidity trends until structural catalyst conversion or broader risk-on sentiment resumes.
Technical Analysis of XRP (XRPUSD)
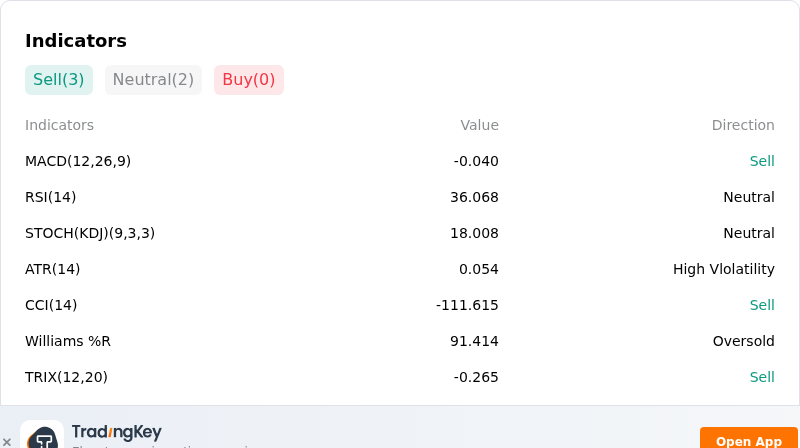
Technically, XRP (XRPUSD) shows a MACD (12,26,9) value of -0.040, indicating a sell signal. The RSI at 36.068 suggests neutral condition and the Williams %R at 91.414 suggests oversold condition. Please monitor closely.
More details about XRP (XRPUSD)
Recent Events and Risks:
- Derivatives Over-Leverage and Liquidation Vulnerability: Following a crypto-market deleveraging event that liquidated nearly $1 billion in leveraged long positions, XRP remains exposed to secondary forced flushes due to long-heavy derivatives positioning if key support between $1.25 and $1.28 breaks.
- Macroeconomic Risk-Off Pressure and Yield Volatility: Hotter-than-expected U.S. CPI inflation readings have pushed Treasury yields higher and renewed rate hike concerns, driving broad risk-off sentiment across high-beta digital assets and dampening speculative crypto flows.
- Deceleration in Institutional Inflows and Spot Liquidity: Capital inflows into spot XRP exchange-traded vehicles have experienced a notable slowdown, thinning spot market depth and leaving order books less equipped to absorb sudden sell orders during derivatives unwinds.
- Technical Breakdown Below Critical Moving Averages: XRP dropped below its rising trendline support and its converged 50-day and 200-day moving average cluster near $1.39, strengthening bearish MACD momentum and raising the risk of further downside toward lower demand zones near $1.15 to $1.25.
This article may include AI-generated content that is human-reviewed, which is for reference and general information purposes only and does not constitute investment advice.
Recommended Articles








Comments (0)
Click the $ button, enter the symbol, and select to link a stock, ETF, or other ticker.