


Novo Nordisk A/S Stock (NVO) Moved Up by 3.38% on Oct 15: What Investors Need To Know



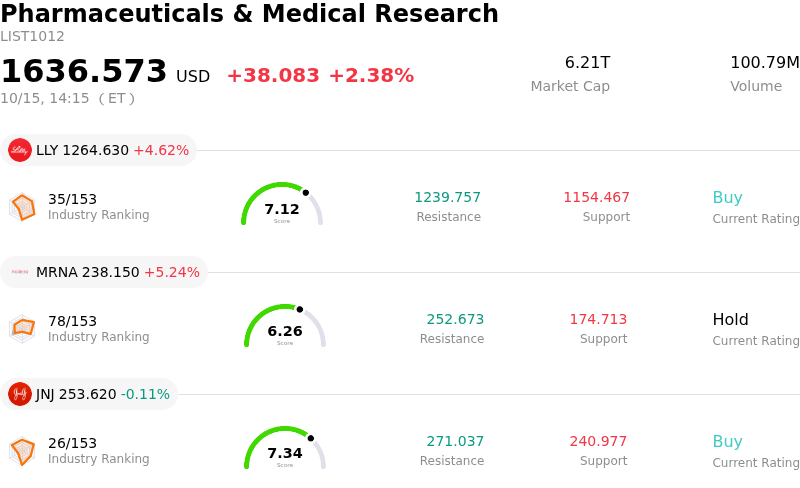
Novo Nordisk A/S (NVO) moved up by 3.38%. The Pharmaceuticals & Medical Research sector is up by 2.38%. The company outperformed the industry. Top 3 stocks by turnover in the sector: Eli Lilly and Co (LLY) up 4.62%; Moderna Inc (MRNA) up 5.24%; Johnson & Johnson (JNJ) down 0.11%.
What is driving Novo Nordisk A/S (NVO)’s stock price up today?
The upward trajectory and heightened intraday volatility in Novo Nordisk shares reflect a combination of value-oriented buying, bullish options positioning, and supportive operational updates following a heavy multi-week pullback. After experiencing selling pressure linked to long-term growth guidance and intense competition in the obesity care space, the stock attracted significant institutional and retail dip-buying. Strong options flow tilted heavily toward call contracts, signaling renewed market confidence and prompt short-covering ahead of the upcoming quarterly earnings release.
Corporate capital allocation has provided a critical floor for share valuation. Novo Nordisk continues to execute its substantial multi-billion share repurchase program, steadily absorbing market supply and signaling executive confidence in intrinsic business value. Furthermore, recent scientific presentations highlighting expanded clinical utility for its obesity and metabolic pipeline—including oral semaglutide formulations and next-generation candidates—have reinforced the company's dominant therapeutic presence despite broader competitive headwinds from rival pharmaceutical leaders.
From a broader market perspective, the stock benefits from attractive compressed valuation metrics relative to historical multiples and peer benchmarks, rendering it a compelling target for institutional rebalancing. While lingering risks around drug pricing negotiations and competitive share shifts persist, the strong daily volume and buying pressure demonstrate that market participants are focusing on high-margin growth drivers and pipeline execution as key catalysts for sustained recovery.
Technical Analysis of Novo Nordisk A/S (NVO)
Technically, Novo Nordisk A/S (NVO) shows a MACD (12,26,9) value of 0.725, indicating a neutral signal. The RSI at 46.379 suggests neutral condition and the Williams %R at 8.834 suggests overbought condition. Please monitor closely.
Fundamental Analysis of Novo Nordisk A/S (NVO)
Novo Nordisk A/S (NVO) is in the Pharmaceuticals & Medical Research industry. Its latest annual revenue is $46.70B, ranking 12 in the industry. The net profit is $15.48B, ranking 4 in the industry. Company Profile
Over the past month, multiple analysts have rated the company as Hold, with an average price target of $49.19, a high of $65.00, and a low of $40.00.
More details about Novo Nordisk A/S (NVO)
Company Specific Risks:
- Analyst Downgrades and U.S. Revenue Deterioration: Price target reductions from major firms, including BMO Capital lowering its target to $40, highlight looming gross-to-net adjustments for flagship drug Ozempic in the U.S. that are expected to exaggerate year-over-year revenue declines and depress quarterly earnings consensus.
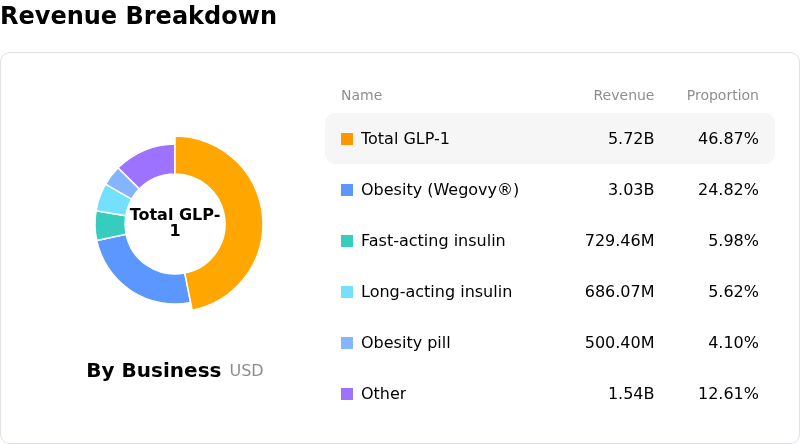
- GLP-1 Market Share Losses and Pricing Mandates: Forced price reductions on Ozempic and Wegovy following U.S. pricing mandates—combined with rapid market share gains by Eli Lilly's competing therapies Zepbound and Mounjaro—continue to compress operating margins and weaken core franchise revenue growth.
- Clinical Pipeline Setbacks and Patent Cliff Concerns: The late-stage Phase 3 ZEUS trial failure for cardiovascular candidate ziltivekimab resulted in Q3 non-cash impairment charges, removing a key pipeline catalyst while reinforcing severe revenue concentration risks ahead of semaglutide's U.S. patent expiries.
- Guidance Downgrades and Technical Trend Breakdown: Technical indicators show persistent selling pressure with shares trading well below 50-day and 200-day moving averages, following management's outlook narrowing 2026 constant-currency revenue guidance down to a potential 6% decline.
This article may include AI-generated content that is human-reviewed, which is for reference and general information purposes only and does not constitute investment advice.
Recommended Articles









Comments (0)
Click the $ button, enter the symbol, and select to link a stock, ETF, or other ticker.