


Solana (SOLUSD) Suddenly Goes down 2.18% on Oct 15: What You Need to Watch



Solana (SOLUSD) is down 2.18% at Oct 15 22:30(ET), now at $100.86, with a 7-day down of 7.37%.
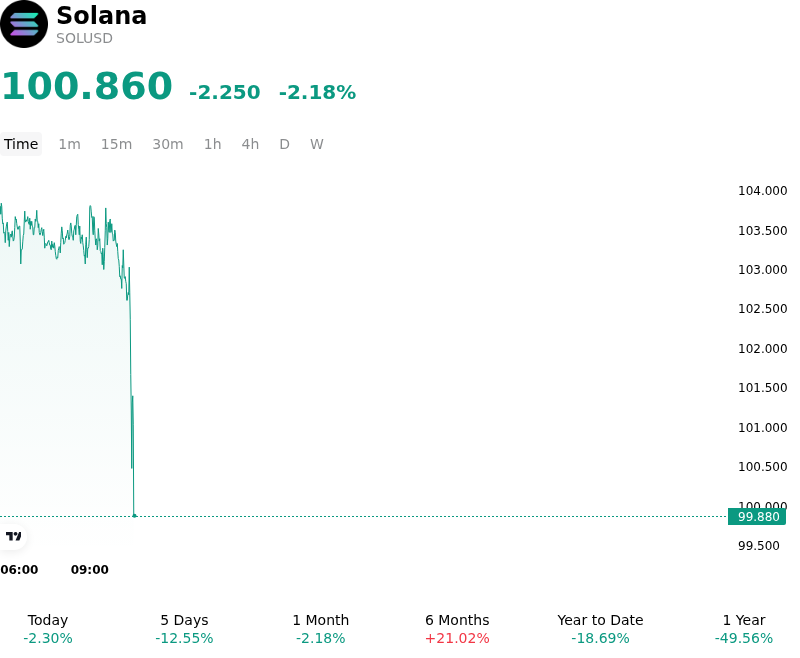
What is driving Solana (SOLUSD)’s stock price down today?
Solana pulled back as broader macroeconomic headwinds and cautious institutional positioning weighed on high-beta digital assets. A hotter-than-expected U.S. inflation reading heightened concerns over sustained Federal Reserve monetary tightening, sending Treasury yields higher and strengthening the U.S. dollar. This macroeconomic shift triggered a generalized risk-off sentiment across crypto markets, with investors scaling back exposure to altcoins and reducing leverage in response to tighter global liquidity expectations.
Institutional flows turned restrictive, with Solana-linked investment products experiencing persistent net outflows. Institutional desks demonstrated risk aversion ahead of Solana's major mainnet infrastructure overhaul, the Alpenglow upgrade, which replaces the network's consensus mechanism to improve finality times. While the upgrade represents a significant technical milestone for long-term scalability, the operational complexity of transitioning live consensus created temporary execution risk, leading institutional capital to adopt a wait-and-see approach rather than accumulating ahead of the deployment.
Derivatives market dynamics amplified the downward pressure on spot prices. The initial decline triggered automated long liquidations across major derivatives venues, causing a cascade of forced selling that flushed out leveraged speculative positioning. Futures open interest contracted, and funding rates reset toward neutral levels, indicating a reduction in bullish leverage. Although ecosystem activity and on-chain transaction volumes remained resilient, near-term price discovery continues to be governed by broader digital asset liquidity trends and macro sentiment.
Technical Analysis of Solana (SOLUSD)
Technically, Solana (SOLUSD) shows a MACD (12,26,9) value of -4.354, indicating a neutral signal. The RSI at 36.663 suggests neutral condition and the Williams %R at 91.788 suggests oversold condition. Please monitor closely.
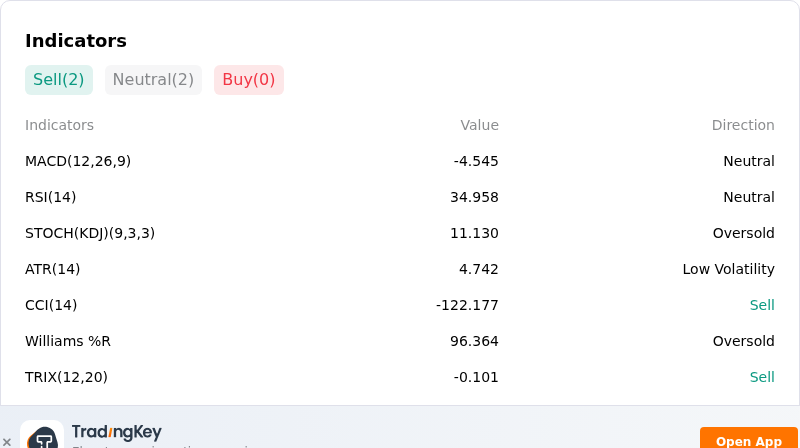
More details about Solana (SOLUSD)
Recent Events and Risks:
- Macro Risk & Broader De-risking: Hotter-than-expected macro inflation metrics and rising Treasury yields have triggered a broad risk-off shift across digital assets, causing high-beta tokens like Solana to experience amplified selling pressure relative to major cryptocurrencies.
- Institutional ETF Net Outflows: Investment products tracking Solana have logged sustained daily net outflows, reflecting weakened institutional demand and removing vital buy-side support required to absorb spot market sell orders.
- Derivatives Liquidation & Negative Funding Rates: Recent spikes in long position liquidations, paired with perpetual futures funding rates shifting negative, signal aggressive leverage unwinds and a prevailing short-side bias across major derivative venues.
- Key Technical Support Vulnerability: SOL has broken below its 20-day moving average and remains vulnerable above the crucial $100–$102 psychological support range, with a breakdown threatening to trigger automated sell-stops toward secondary support levels near $93.
This article may include AI-generated content that is human-reviewed, which is for reference and general information purposes only and does not constitute investment advice.
Recommended Articles









Comments (0)
Click the $ button, enter the symbol, and select to link a stock, ETF, or other ticker.