


Palo Alto Networks Inc Stock (PANW) Moved Down by 4.41% on Oct 14: Drivers Behind the Movement



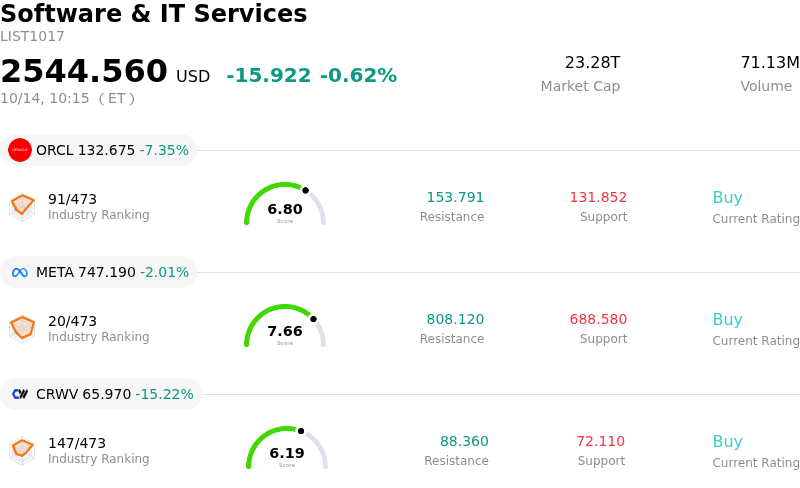
Palo Alto Networks Inc (PANW) moved down by 4.41%. The Software & IT Services sector is down by 0.62%. The company underperformed the industry. Top 3 stocks by turnover in the sector: Oracle Corp (ORCL) down 7.39%; Meta Platforms Inc (META) down 2.01%; CoreWeave Inc (CRWV) down 15.09%.
What is driving Palo Alto Networks Inc (PANW)’s stock price down today?
Palo Alto Networks experienced notable downside pressure as valuation friction and profit-taking continued to weigh on sentiment following a multi-month enterprise software rally. Investor scrutiny around high earnings multiples intensified after recent Wall Street downgrade actions and rating adjustments, which highlighted stretched valuations relative to historical software benchmarks. With the stock trading near high historical levels prior to the retracement, short-term traders and institutional funds engaged in profit-taking to de-risk portfolios.
Market sentiment was further dampened by recent regulatory filings detailing executive insider transaction activity and structured share derivative arrangements. News of forward hedging contracts and ongoing insider equity sales elevated supply concerns among market participants, compounding selling pressure across the cybersecurity cohort during broader volatility in high-multiple technology equities.
Despite the immediate momentum pullback, the core structural thesis for Palo Alto Networks remains supported by its strategic platformization initiative, healthy enterprise cross-selling, and expanding addressable market in artificial intelligence security solutions. Institutional investors will focus closely on upcoming quarterly earnings execution and annual recurring revenue trajectory in Next-Generation Security to evaluate whether fundamentals can reaccelerate stock momentum.
Technical Analysis of Palo Alto Networks Inc (PANW)
Technically, Palo Alto Networks Inc (PANW) shows a MACD (12,26,9) value of -4.509, indicating a neutral signal. The RSI at 46.980 suggests neutral condition and the Williams %R at 83.719 suggests oversold condition. Please monitor closely.
Media Coverage of Palo Alto Networks Inc (PANW)
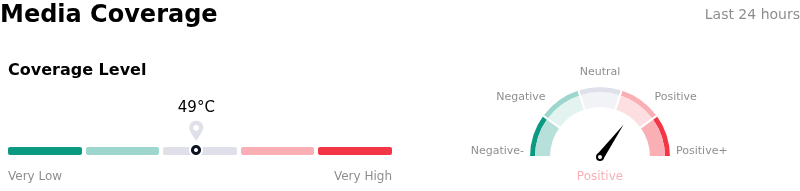
In terms of media coverage, Palo Alto Networks Inc (PANW) shows a coverage score of 49, indicating a moderate level of media attention. The overall market sentiment index is currently in bullish zone.
Fundamental Analysis of Palo Alto Networks Inc (PANW)
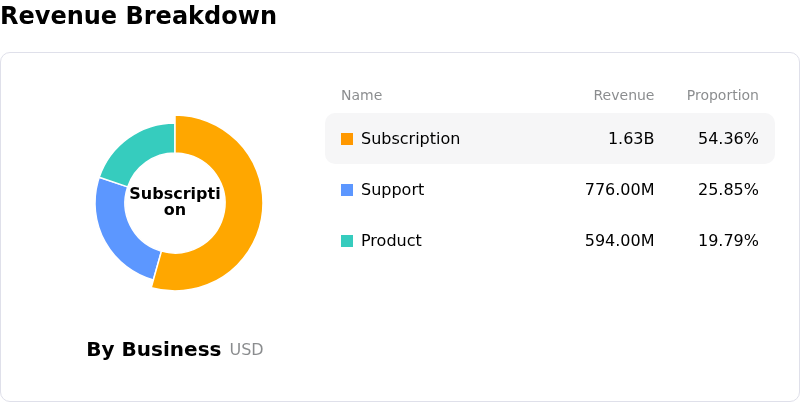
Palo Alto Networks Inc (PANW) is in the Software & IT Services industry. Its latest annual revenue is $11.48B, ranking 33 in the industry. The net profit is $307.00M, ranking 90 in the industry. Company Profile
Over the past month, multiple analysts have rated the company as Buy, with an average price target of $399.52, a high of $525.00, and a low of $190.00.
More details about Palo Alto Networks Inc (PANW)
Company Specific Risks:
- Wall Street Downgrade on Stretched Valuation: Phillip Securities downgraded PANW to Neutral from Buy with a $346 price target, pointing out that the stock is vulnerable after trading at roughly 97 times forward earnings compared to its historical average of 54 times, sparking institutional profit-taking.
- Active Exploitation of PAN-OS Vulnerabilities: Threat intelligence advisories confirmed that active ransomware operators are exploiting a critical authentication bypass flaw (CVE-2026-0257) in PAN-OS GlobalProtect and Prisma Access to breach customer networks, elevating reputational and operational liabilities.
- Executive Insider Share Monetization Disclosure: Regulatory filings showed that CEO Nikesh Arora's trust executed a variable prepaid forward contract involving 500,000 common shares valued at approximately $201.4 million with an approximate sale date of October 12, 2026, raising concerns over executive insider liquidation.
- Technical Momentum Reversal and Overbought Unwinding: Key short-term indicators—including the 10-day RSI and Stochastic Oscillators—have exited overbought territory and dropped below short-term moving averages, triggering automated momentum-selling after a multi-week rally to near 52-week highs.
This article may include AI-generated content that is human-reviewed, which is for reference and general information purposes only and does not constitute investment advice.
Recommended Articles







Comments (0)
Click the $ button, enter the symbol, and select to link a stock, ETF, or other ticker.