


Ethereum (ETHUSD) Is down 1.02% on Oct 14: What Do On-Chain Data and Market Sentiment Show?



Ethereum (ETHUSD) is down 1.02% at Oct 14 06:05(ET), now at $2482.71, with a 7-day down of 3.47%.
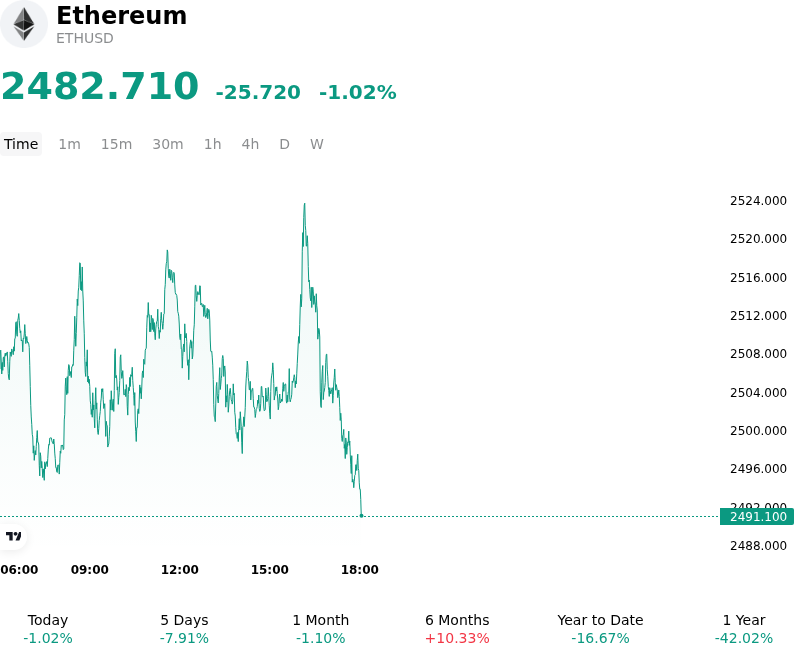
What is driving Ethereum (ETHUSD)’s stock price down today?
Ethereum experienced downside pressure and elevated intraday volatility as persistent weakness in U.S. spot Ethereum ETF demand weighed on market sentiment. Sequential net redemptions from institutional fund products have diminished spot absorption capacity, removing a critical structural buyer from the order book. This institutional hesitation coincides with macro uncertainty ahead of key U.S. economic data releases, which has kept Treasury yields firm and constrained overall appetite for high-beta risk assets.
On-chain metrics further compounded selling pressure as exchange-bound token transfers increased, elevating exchange reserves to multi-week highs. Large-scale over-the-counter liquidations and profit-taking by prominent market participants added localized spot supply, overwhelming bid depth near key technical support levels. While selective capital rebalancing partially absorbed the distribution, the influx of exchange liquidity created an asymmetric order book tilt that favored downside price discovery.
In the derivatives market, soft spot price action triggered localized long-side leverage unwinding, amplifying volatility near key psychological floors. Although core network metrics—including upcoming protocol upgrades and Layer-2 adoption—continue to underpin long-term structural adoption expectations, near-term price discovery remains tethered to institutional ETF flow stabilization and broader macroeconomic liquidity conditions. Market participants remain focused on institutional fund flows and exchange reserve trends for signs of supply exhaustion.
Technical Analysis of Ethereum (ETHUSD)
Technically, Ethereum (ETHUSD) shows a MACD (12,26,9) value of -52.592, indicating a neutral signal. The RSI at 40.873 suggests neutral condition and the Williams %R at 76.026 suggests sell condition. Please monitor closely.
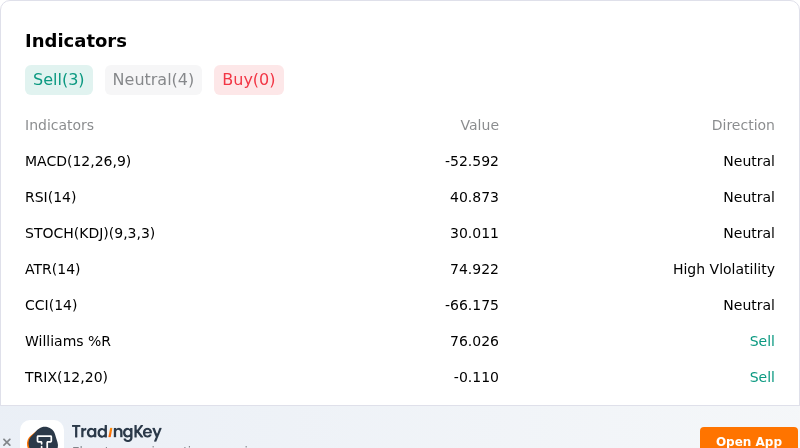
More details about Ethereum (ETHUSD)
Recent Events and Risks:
- Institutional Spot ETF Outflows: Prolonged net redemptions from U.S. spot Ethereum ETFs—which experienced up to ten consecutive sessions of negative flows totaling over $540 million—have severely drained institutional spot demand and capped price recovery attempts.
- Futures Leverage Unwinds and Bearish Taker Volume: Derivatives market volatility forced over $170 million in Ethereum liquidations during recent sell-offs, driving open interest to multi-month lows while net taker volume remains dominated by sell-side market orders, signaling persistent trader caution.
- Whale Offloading and Surging Exchange Inflows: On-chain activity showed substantial large-holder distribution, including a major wallet dumping 52,001 ETH, which drove a sudden surge in exchange inflows and heightened downside pressure on the $2,500 support zone.
- Cross-Asset Volatility and Risk-Off Contagion: Sharp downturns in global equity markets alongside rising U.S. Treasury yields spurred risk-off sentiment, prompting capital rotation out of higher-beta digital assets like ETH and into relative safe havens.
This article may include AI-generated content that is human-reviewed, which is for reference and general information purposes only and does not constitute investment advice.
Recommended Articles








Comments (0)
Click the $ button, enter the symbol, and select to link a stock, ETF, or other ticker.