


Illumina Inc Stock (ILMN) Moved Up by 7.85% on Oct 5: Drivers Behind the Movement



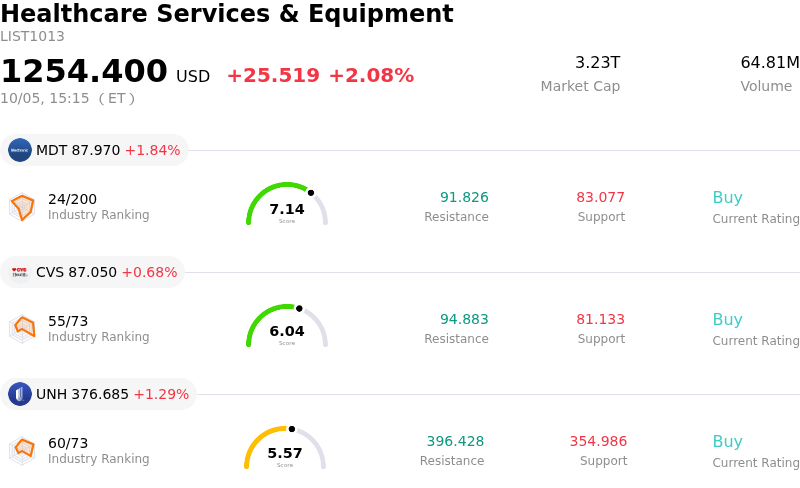
Illumina Inc (ILMN) moved up by 7.85%. The Healthcare Services & Equipment sector is up by 2.08%. The company outperformed the industry. Top 3 stocks by turnover in the sector: Medtronic PLC (MDT) up 1.84%; CVS Health Corp (CVS) up 0.68%; Unitedhealth Group Inc (UNH) up 1.29%.
What is driving Illumina Inc (ILMN)’s stock price up today?
Illumina experienced strong upward price momentum driven primarily by major price target increases from prominent Wall Street research firms. RBC Capital significantly raised its target price on the stock while reiterating an Outperform rating, citing an accelerating inflection in clinical sequencing demand and a broader valuation re-rating across the life sciences ecosystem. Research analysts highlighted that high-throughput sequencing and genomic tools companies are increasingly recognized as essential infrastructure beneficiaries of artificial intelligence applications in drug discovery and molecular diagnostics. Positive revisions from additional investment banks further catalyzed bullish sentiment across the institutional landscape.
Underpinning the constructive analyst outlook is durable fundamental momentum within Illumina's core sequencing business. The company continues to see strong placement velocity for its flagship NovaSeq X platform, accompanied by expanding usage of high-margin clinical consumables across oncology and reproductive health end-markets. Following strategic portfolio streamlining and a renewed focus on core operations, Illumina has achieved improving operating margins, robust cash flow generation, and elevated earnings visibility that previously enabled management to lift full-year revenue and profitability guidance.
Broader market dynamics and structural index demand also contributed to the intraday buying interest. Recent inclusion in key benchmark indexes, including the S&P 500, has generated consistent portfolio rebalancing demand from passive funds and institutional managers. Although elevated trading volume brought increased intraday price swings as investors weighed current valuation multiples against medium-term targets, expanding clinical adoption of next-generation sequencing and scaling multiomics applications continue to provide strong fundamental backing.
Technical Analysis of Illumina Inc (ILMN)
Technically, Illumina Inc (ILMN) shows a MACD (12,26,9) value of 6.198, indicating a buy signal. The RSI at 76.850 suggests buy condition and the Williams %R at 0.491 suggests overbought condition. Please monitor closely.
Media Coverage of Illumina Inc (ILMN)
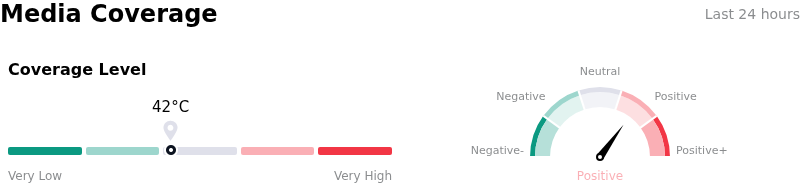
In terms of media coverage, Illumina Inc (ILMN) shows a coverage score of 42, indicating a moderate level of media attention. The overall market sentiment index is currently in bullish zone.
Fundamental Analysis of Illumina Inc (ILMN)
Illumina Inc (ILMN) is in the Healthcare Services & Equipment industry. Its latest annual revenue is $4.34B, ranking 26 in the industry. The net profit is $850.00M, ranking 20 in the industry. Company Profile
Over the past month, multiple analysts have rated the company as Buy, with an average price target of $205.48, a high of $305.00, and a low of $113.00.
More details about Illumina Inc (ILMN)
Company Specific Risks:
- Stretched Valuation and Overbought Technical Setup: Following a sharp multi-month rally toward 52-week highs, ILMN trades at a significant premium to consensus fair-value estimates, with technical indicators showing overbought conditions that heighten downside risk from momentum-driven intraday pullbacks.
- Aggressive Insider Selling: SEC disclosures indicate extensive corporate insider liquidations totaling over $436 million in recent months—notably large sales by board leadership—signaling potential internal skepticism regarding further upside at elevated multiples.
- Sluggish Organic Growth and Sector Macro Headwinds: Underlying organic revenue expansion remains modest in the single digits, constrained by tightened U.S. academic research budgets, volatile clinical funding, and ongoing structural demand softness in key growth markets such as China.
- Debt Refinancing Pressures and Paused Capital Returns: The issuance of a $300 million note offering to refinance impending debt maturities has constrained free cash flow flexibility, forcing management to decelerate share buybacks to maintain adequate balance-sheet liquidity.
This article may include AI-generated content that is human-reviewed, which is for reference and general information purposes only and does not constitute investment advice.
Recommended Articles










Comments (0)
Click the $ button, enter the symbol, and select to link a stock, ETF, or other ticker.