


Solana (SOLUSD) Is up 1.08% on Oct 3: Why It Happened



Solana (SOLUSD) is up 1.08% at Oct 3 21:00(ET), now at $118.03, with a 7-day down of 1.10%.
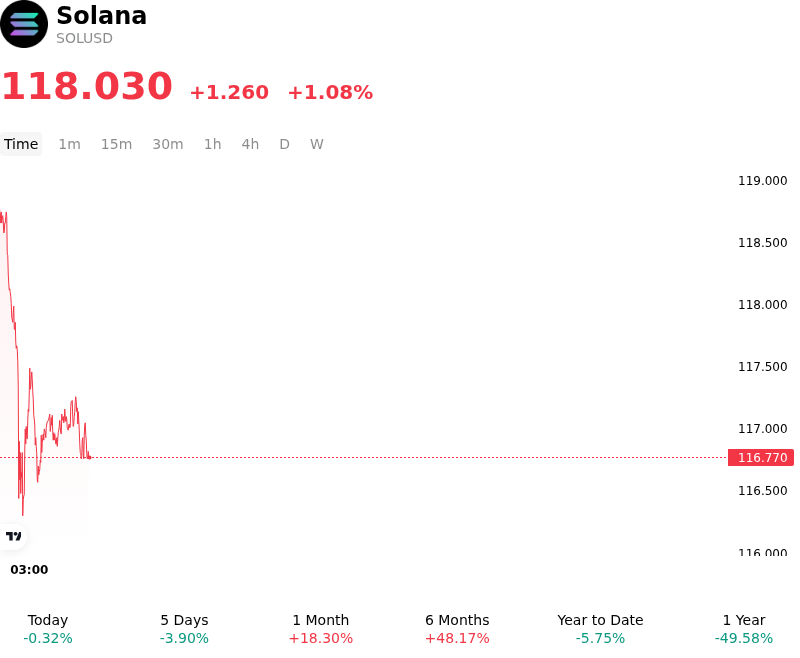
What is driving Solana (SOLUSD)’s stock price up today?
Capital flowed into Solana as persistent institutional demand via spot Solana exchange-traded funds provided structural buying support across digital asset trading sessions. Sustained net inflows into spot Solana ETFs demonstrate that institutional allocators are increasingly treating the token as a core high-throughput smart contract asset alongside Bitcoin and Ethereum. This structural bid has tightened spot market liquidity on major exchanges, absorbing overhead sell pressure and encouraging systematic capital allocations into the market.
Reinforcing institutional confidence, Solana's fundamental ecosystem metrics continue to reflect robust network utilization and capital retention. Dominant performance across decentralized exchange throughput, real-world asset tokenization, and stablecoin settlement volume has sustained the network's leading share of on-chain application revenue. High staking participation rates continue to reduce circulating exchange supply, dampening potential downside volatility. Furthermore, ongoing technical milestones and validator infrastructure developments, including long-term performance optimizations like Firedancer, maintain strong expectations for sustained throughput scalability.
From a global macro perspective, favorable liquidity conditions and steady risk appetite across broader risk assets have facilitated cross-market capital rotation into high-beta layer-one protocols. Expanding open interest in perpetual futures and derivatives venues points to constructive market positioning rather than speculative leverage exhaustion. While investors continue to monitor broader regulatory developments and scheduled supply unlocks, the underlying move reflects a solid alignment of spot ETF demand, deep ecosystem execution, and constructive risk-on sentiment.
Technical Analysis of Solana (SOLUSD)
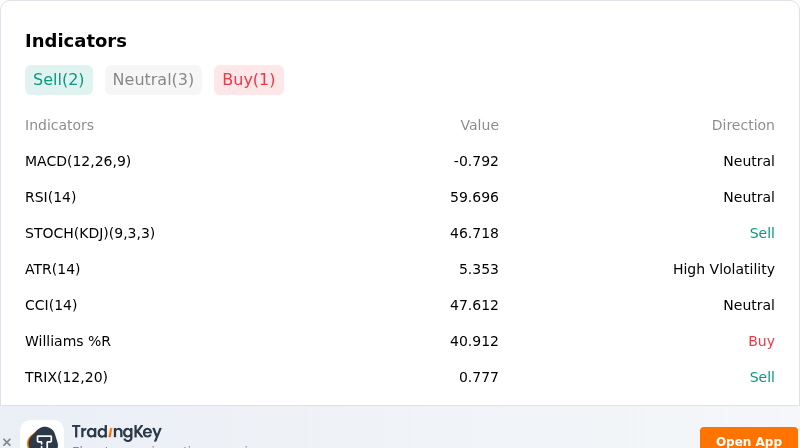
Technically, Solana (SOLUSD) shows a MACD (12,26,9) value of -0.792, indicating a neutral signal. The RSI at 59.696 suggests neutral condition and the Williams %R at 40.912 suggests buy condition. Please monitor closely.
More details about Solana (SOLUSD)
Recent Events and Risks:
- Whale Unstaking and Centralized Exchange Inflows: On-chain tracking highlights substantial whale activity, including major wallet unstaking and multi-million dollar transfers directly to centralized exchanges like Binance, creating immediate sell-side supply pressure and overhead resistance.
- Derivatives Over-Leverage and Liquidation Cascades: Futures open interest remains heavily skewed toward long positions near key technical support levels, leaving Solana highly vulnerable to forced liquidation cascades and sharp intraday drawdowns if price pivots break down.
- Mainnet Upgrade Timeline Uncertainty: Speculative momentum experienced a cooldown after core developers confirmed that the performance-enhancing Alpenglow consensus upgrade remains confined to the testnet phase without a confirmed mainnet deployment date, prompting sell-the-fact profit-taking.
- Macro Risk-Off Sentiment and High-Beta Exposure: Persistent upward pressure on U.S. Treasury yields and U.S. dollar strength continue to tighten global liquidity, exposing high-beta altcoins like Solana to outsized macro-driven selling and contracting decentralized exchange (DEX) trading volumes.
This article may include AI-generated content that is human-reviewed, which is for reference and general information purposes only and does not constitute investment advice.
Recommended Articles










Comments (0)
Click the $ button, enter the symbol, and select to link a stock, ETF, or other ticker.