


GBP/USD (GBPUSD) Is up 0.52% on Sep 30: What Signals Does the Macro Data Send?



GBP/USD (GBPUSD) is up 0.52% at Sep 30 06:40(ET), now at $1.32981, with a 7-day up of 0.48%.
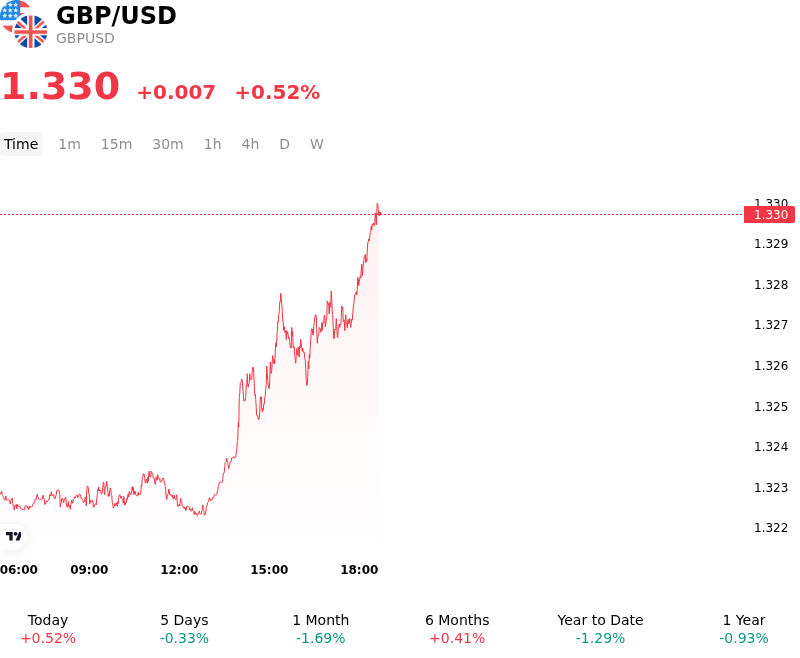
What is driving GBP/USD (GBPUSD)’s stock price up today?
The British pound advanced against the US dollar as a combination of stronger-than-expected UK economic data and a dovish tilt in U.S. Federal Reserve rate expectations shifted short-term yield differentials in favor of Sterling. The primary domestic catalyst was the Office for National Statistics revising UK second-quarter gross domestic product growth higher to 0.5% quarter-on-quarter, up from the initial 0.4% estimate. The upward revision was propelled by continued resilience in services and construction activity, defying consensus expectations for an unrevised print. This economic performance reinforced expectations that the Bank of England will maintain a restrictive policy stance for longer, dampening near-term rate cut speculation and providing direct fundamental support for Sterling.
Simultaneously, the US dollar faced broad downward pressure following pushback from senior Federal Reserve officials regarding the urgency of near-term policy tightening. Remarks from New York Fed President John Williams, emphasizing a cautious approach to further rate hikes, led money markets to pare back odds of an immediate rate increase at the next Federal Open Market Committee meeting. The softening in hawkish Fed bets triggered a retreat in U.S. Treasury yields across the curve, reducing the dollar's relative yield advantage. The greenback's decline was further exacerbated by month-end institutional portfolio rebalancing, as asset managers took profits on extended dollar positions following multi-week gains.
From a macro perspective, the recovery in the pair reflects a mean-reversion reaction after testing key technical support levels. While the upward revision to UK growth provides a floor for Sterling sentiment in the short term, institutional investors remain focused on relative interest-rate trajectories and incoming inflation data. Unless upcoming U.S. economic indicators show a significant easing of domestic inflationary pressures, the advance may confront resistance from elevated long-term U.S. yields, leaving market participants to evaluate whether UK growth resilience can sustain a broader trend reversal.
Technical Analysis of GBP/USD (GBPUSD)
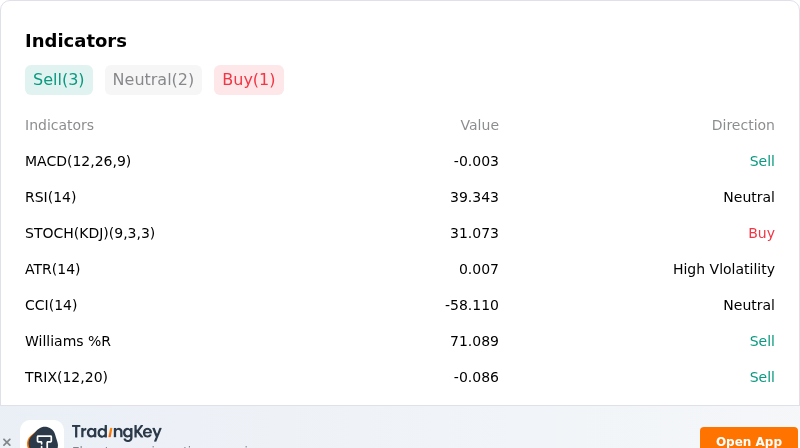
Technically, GBP/USD (GBPUSD) shows a MACD (12,26,9) value of -0.003, indicating a sell signal. The RSI at 39.343 suggests neutral condition and the Williams %R at 71.089 suggests sell condition. Please monitor closely.
More details about GBP/USD (GBPUSD)
Recent Events and Risks:
- Monetary Policy Divergence and Yield Pressure: Hawkish Federal Reserve rate expectations and elevated US Treasury yields—reaching multi-year highs near 5.15%—continue to widen yield differentials against Sterling. While Fed officials reiterate readiness for further policy tightening to combat persistent inflation, the Bank of England faces severe constraints from a slowing domestic economy, keeping GBP/USD under downside pressure.
- UK Fiscal Constraints and Stagflation Concerns: Higher-than-expected UK public sector net borrowing alongside forecasts of slowing quarterly economic growth in the second half of the year heighten stagflationary risks. These fiscal pressures ahead of the upcoming UK budget limit the scope for aggressive Bank of England tightening, leaving Sterling vulnerable to downside selling.
- Safe-Haven Dollar Demand and Commodity Inflation: Geopolitical friction and elevated crude oil prices have reignited global supply-side inflation fears and weighed on market risk sentiment. This environment favors safe-haven capital inflows into the US Dollar at the expense of risk-sensitive Sterling, compounding intraday downside risks for the pair.
- Technical Deterioration Below Key Support: GBP/USD's move toward three-month lows near 1.3200 and a potential bearish cross of its 50-day and 200-day exponential moving averages have intensified selling momentum. A sustained breakdown below the 1.3200 support zone risks accelerating stops toward the YTD low around 1.3140.
This article may include AI-generated content that is human-reviewed, which is for reference and general information purposes only and does not constitute investment advice.
Recommended Articles









Comments (0)
Click the $ button, enter the symbol, and select to link a stock, ETF, or other ticker.