


Trane Technologies PLC Stock (TT) Moved Up by 3.71% on Sep 25: Facts Behind the Movement



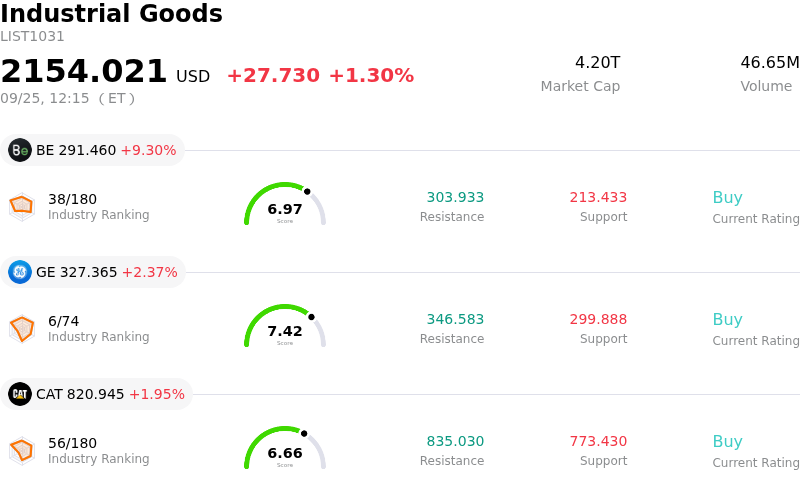
Trane Technologies PLC (TT) moved up by 3.71%. The Industrial Goods sector is up by 1.30%. The company outperformed the industry. Top 3 stocks by turnover in the sector: Bloom Energy Corp (BE) up 9.13%; General Electric Co (GE) up 2.36%; Caterpillar Inc (CAT) up 1.95%.
What is driving Trane Technologies PLC (TT)’s stock price up today?
Trane Technologies experienced strong upward momentum following a notable bullish catalyst from Wall Street. Wells Fargo initiated coverage on the company with an Overweight rating and an optimistic price target, signaling substantial potential upside. Analysts emphasized that a recent pullback in the equity created an attractive entry point for investors, citing the firm's top-tier earnings growth trajectory and favorable exposure to commercial heating, ventilation, and air conditioning demand, particularly driven by rapid artificial intelligence data center infrastructure buildouts.
The positive market sentiment is further supported by the company's exceptionally strong operational backlog and consistent financial execution. Unprecedented backlog visibility extending multi-year horizons across commercial HVAC, energy-efficient building systems, and electrified cold-chain transport solutions provides high confidence in future revenue streams. Furthermore, ongoing strategic initiatives—such as high-efficiency cooling architectures for data centers and the expansion of electric transport refrigeration units—position the company at the intersection of long-term decarbonization and technology infrastructure trends.
From a broader market perspective, stabilizing Treasury yields and positive momentum across industrial equipment peers created a supportive macroeconomic backdrop. With a strong history of beating quarterly financial estimates, raising full-year forward guidance, and generating solid free cash flow to support ongoing capital returns to shareholders, institutional investor confidence in the business model remains firm. The confluence of positive analyst coverage, strategic alignment with high-growth end markets, and robust fundamentals drove the stock's performance.
Technical Analysis of Trane Technologies PLC (TT)
Technically, Trane Technologies PLC (TT) shows a MACD (12,26,9) value of 5.472, indicating a neutral signal. The RSI at 58.126 suggests neutral condition and the Williams %R at 1.800 suggests overbought condition. Please monitor closely.
Media Coverage of Trane Technologies PLC (TT)
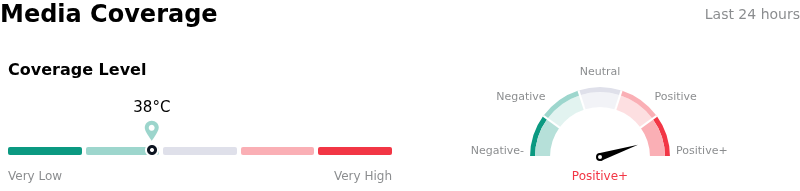
In terms of media coverage, Trane Technologies PLC (TT) shows a coverage score of 38, indicating a low level of media attention. The overall market sentiment index is currently in extremely bullish zone.
Fundamental Analysis of Trane Technologies PLC (TT)
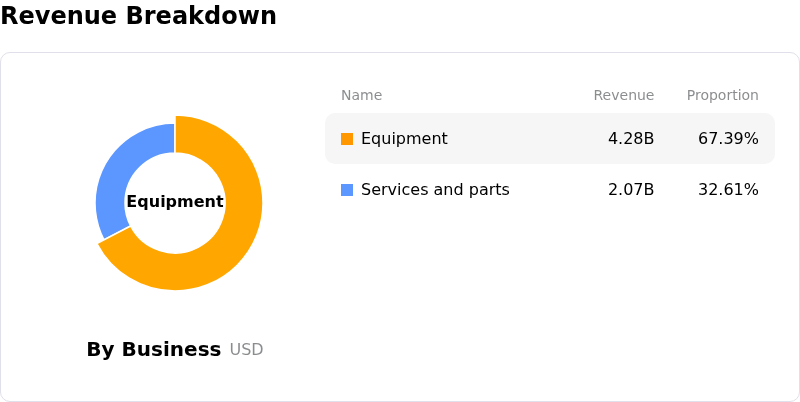
Trane Technologies PLC (TT) is in the Industrial Goods industry. Its latest annual revenue is $21.32B, ranking 9 in the industry. The net profit is $2.92B, ranking 6 in the industry. Company Profile
Over the past month, multiple analysts have rated the company as Buy, with an average price target of $522.49, a high of $575.00, and a low of $430.44.
More details about Trane Technologies PLC (TT)
Company Specific Risks:
- Elevated Valuation Premium: Trading at over 33x trailing earnings, well above the industrial sector average of 18.5x, leaving the stock vulnerable to sharp pullbacks if growth rates decelerate.
- Substantial Insider Stock Selling: Recent SEC filings reveal over $20.8 million in insider share liquidations, signaling institutional caution and profit-taking at elevated valuation levels.
- Segment Weakness in European Operations: Revenue in the EMEA region contracted 1% year-over-year in recent financial reports, reflecting persistent macroeconomic friction and softer demand in European commercial HVAC markets.
- Leveraged Balance Sheet and Cyclical Vulnerability: The company carries a net debt-to-equity ratio of approximately 41%, exposing its earnings to elevated debt-servicing costs should non-residential commercial construction demand slow.
This article may include AI-generated content that is human-reviewed, which is for reference and general information purposes only and does not constitute investment advice.
Recommended Articles








Comments (0)
Click the $ button, enter the symbol, and select to link a stock, ETF, or other ticker.