


Unity Software Inc Stock (U) Moved Down by 10.59% on Sep 24: Drivers Behind the Movement



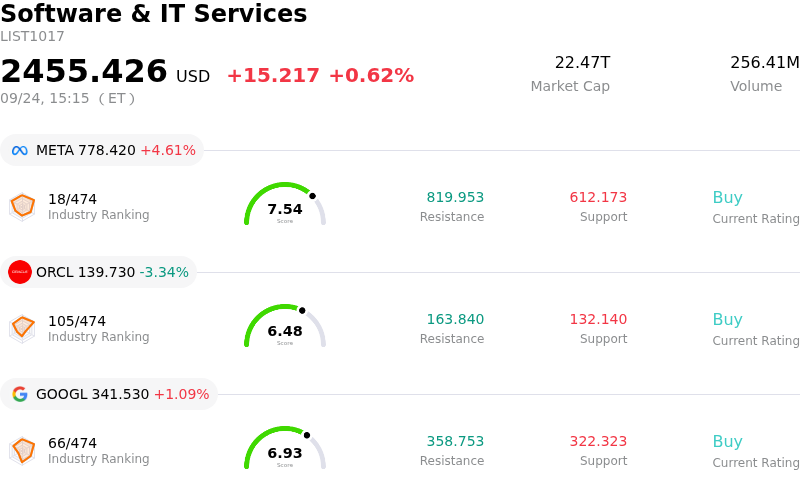
Unity Software Inc (U) moved down by 10.59%. The Software & IT Services sector is up by 0.62%. The company underperformed the industry. Top 3 stocks by turnover in the sector: Meta Platforms Inc (META) up 4.61%; Oracle Corp (ORCL) down 3.34%; Alphabet Inc Class A (GOOGL) up 1.09%.
What is driving Unity Software Inc (U)’s stock price down today?
The sharp downward pressure on Unity Software Inc. shares stems primarily from competitive disruptions announced at Meta's annual Connect event. Meta unveiled new generative artificial intelligence game-creation tools, Horizon Create and Horizon Studio, which enable users to build interactive two-dimensional and three-dimensional experiences through natural language text prompts. By drastically lowering the technical barrier to entry for content creation, Meta's entry into simplified game development tools presents a potential competitive threat to Unity's core engine ecosystem. Investors reacted with heightened concern that accessible, AI-native creation suites from mega-cap tech companies could erode Unity's developer base and dilute its long-term pricing power.
Compounding the negative industry dynamics is ongoing market scrutiny surrounding Unity's strategic pivot and valuation profile. While recent earnings reports showed operational improvements and momentum in profitability, management's strategic decision to wind down legacy businesses—such as its legacy ad network—has created short-term revenue friction. With the company's valuation metrics reflecting high expectations for future growth despite ongoing profitability challenges, market participants demonstrated reduced tolerance for fresh competitive risks, leading to swift profit-taking.
Broader macroeconomic conditions and technical setup further amplified the intraday selling. A notable rise in long-term Treasury yields created a headwind for growth-oriented technology equities, curbing risk sentiment across the software space. Technically, the stock had been testing key resistance levels following a recent rally, leaving momentum indicators vulnerable to negative catalysts. The combination of higher discount rates, overbought technical conditions, and competitive headlines from a major strategic partner generated significant volatility and driven institutional position adjustments.
Technical Analysis of Unity Software Inc (U)
Technically, Unity Software Inc (U) shows a MACD (12,26,9) value of -0.773, indicating a neutral signal. The RSI at 41.821 suggests neutral condition and the Williams %R at 88.608 suggests oversold condition. Please monitor closely.
Fundamental Analysis of Unity Software Inc (U)
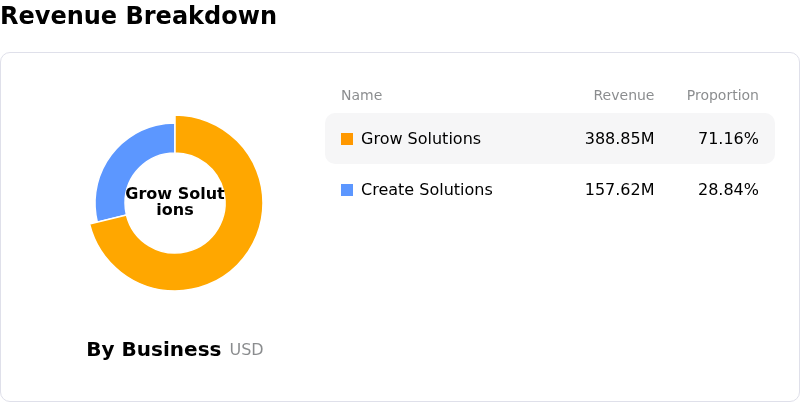
Unity Software Inc (U) is in the Software & IT Services industry. Its latest annual revenue is $1.85B, ranking 130 in the industry. The net profit is $-402.76M, ranking 586 in the industry. Company Profile
Over the past month, multiple analysts have rated the company as Buy, with an average price target of $49.85, a high of $55.00, and a low of $41.94.
More details about Unity Software Inc (U)
Company Specific Risks:
- Excessive Valuation Multiples and Fair Value Disconnect: Financial analysis highlights that Unity Software is trading at a Price-to-Sales ratio of over 9x and a Forward P/E exceeding 35x, placing the share price roughly 64% above intrinsic fair-value estimates ($26.36 versus current trading levels around $43–$44) and leaving the stock exposed to sharp downside re-ratings.
- Persistent Executive and Insider Stock Disposals: Regulatory disclosures show zero insider open-market purchases over the past year alongside $61 million in insider sales, including recent equity disposals by Chief Operating Officer Alexander Blum and Chief Executive Officer Matthew Bromberg, creating downside selling pressure and signaling caution from management.
- Spike in Derivatives Volatility and Downside Hedging: Options market activity shows 3-month implied volatility escalating above 60% alongside a rising 90/110 put-call skew, indicating that institutional investors are actively layering in downside put protection against impending short-term volatility.
- Structural Unprofitability and Operating Margin Pressures: Despite top-line revenue growth, Unity remains GAAP unprofitable with trailing 12-month operating margins at negative 30.4%, driving institutional skepticism over whether fixed-cost leverage and billings growth can reliably convert into long-term net cash generation.
This article may include AI-generated content that is human-reviewed, which is for reference and general information purposes only and does not constitute investment advice.
Recommended Articles








Comments (0)
Click the $ button, enter the symbol, and select to link a stock, ETF, or other ticker.