


First Solar Inc Stock (FSLR) Moved Down by 7.12% on Sep 24: Facts Behind the Movement



First Solar Inc (FSLR) moved down by 7.12%. The Renewable Energy sector is down by 5.93%. The company underperformed the industry. Top 3 stocks by turnover in the sector: First Solar Inc (FSLR) down 7.47%; Enphase Energy Inc (ENPH) down 3.79%; Sunrun Inc (RUN) down 7.01%.
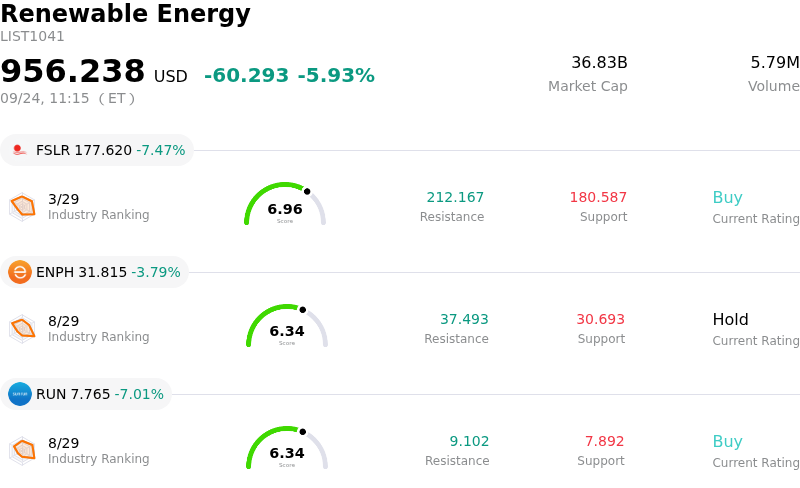
What is driving First Solar Inc (FSLR)’s stock price down today?
The downward trajectory in First Solar's stock reflects persistent investor anxiety regarding the broader domestic policy environment and long-term utility-scale solar demand. While First Solar benefits from a substantial contracted backlog and clean energy incentives, market participants remain cautious about prospective regulatory shifts, potential tariff recalibrations, and delays in project execution. Industry-wide concerns over project financing costs and grid interconnection bottlenecks continue to weigh on forward revenue visibility, prompting investors to reassess the timing of cash conversion from long-term module commitments.
Sentiment has also been dampened by recent shifts in the company's legal and competitive positioning. First Solar's withdrawal of its trade complaint at the U.S. International Trade Commission regarding silicon TOPCon patent enforcement introduced lingering uncertainty over its intellectual property defense strategy. Although management characterized the move as procedural, institutional investors interpreted it as a signal of potential friction in protecting domestic market share. This strategic pivot, combined with recent year-over-year revenue contractions in quarterly performance, has intensified scrutiny around operational execution and unit cost control across its expanding manufacturing footprint.
From a market strategy perspective, sustained technical selling pressure and analyst target revisions have exacerbated short-term volatility. Ongoing insider share reductions alongside selective Wall Street downgrades have weakened institutional sentiment. Furthermore, despite attractive valuation metrics relative to projected earnings growth, technical weakness with the stock trading below key moving averages has encouraged capital outflow toward more defensive allocations, compounding downside pressure in the session.
Technical Analysis of First Solar Inc (FSLR)
Technically, First Solar Inc (FSLR) shows a MACD (12,26,9) value of -2.588, indicating a sell signal. The RSI at 33.326 suggests neutral condition and the Williams %R at 97.014 suggests oversold condition. Please monitor closely.
Fundamental Analysis of First Solar Inc (FSLR)
First Solar Inc (FSLR) is in the Renewable Energy industry. Its latest annual revenue is $5.22B, ranking 3 in the industry. The net profit is $1.53B, ranking 1 in the industry. Company Profile
Over the past month, multiple analysts have rated the company as Buy, with an average price target of $268.10, a high of $402.00, and a low of $150.00.
More details about First Solar Inc (FSLR)
Company Specific Risks:
- Revenue Contraction and Growth Softness: Recent financial performance shows a top-line net sales decline of over 3% year-over-year, signaling near-term demand softness and lumpy revenue conversion despite holding a long-term contracted backlog.
- Policy Catalyst Delays and Tariff Ambiguity: Although U.S. regulators finalized anti-dumping duties against foreign panel importers, the lack of immediate, company-specific financial protections in the ruling has heightened anxiety over how quickly trade policies will translate into top-line margin expansion.
- Execution and Capacity Expansion Headwinds: Rapid manufacturing scale-up across new domestic facilities exposes First Solar to construction delays, supply chain bottlenecks, and potential pricing pushback from utility-scale customers adjusting project timelines.
- Technical Breakdown and Capital Outflows: FSLR shares recently touched a new 52-week low of $182.88 amid sustained intraday selling pressure, further compounded by technical chart breakdowns across all major moving averages and over $41 million in net insider stock liquidations over the past 12 months.
This article may include AI-generated content that is human-reviewed, which is for reference and general information purposes only and does not constitute investment advice.
Recommended Articles








Comments (0)
Click the $ button, enter the symbol, and select to link a stock, ETF, or other ticker.