


WTI (USOIL) Is down 2.13% on Sep 22: What Is Driving the Move?



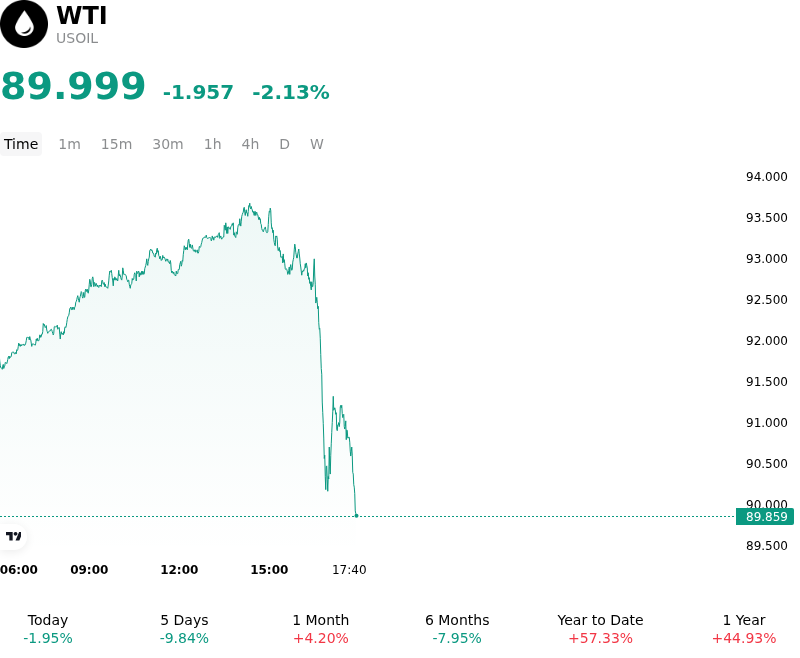
WTI (USOIL) is down 2.13% at Sep 22 05:55(ET), now at $89.999, with a 7-day down of 12.84%.
What is driving WTI (USOIL)’s stock price down today?
The retreat in US crude oil benchmark prices was primarily driven by a rapid unwinding of geopolitical risk premia alongside indications of normalizing energy transit flows. Market sentiment shifted lower as reports surfaced regarding potential diplomatic engagements during international summits, easing immediate fears of severe, prolonged supply disruptions through key Middle Eastern transit routes. Tanker tracking data and physical market updates pointing to a gradual recovery in regional crude export flows further reassured market participants, prompting long liquidation and profit-taking across front-month futures contracts.
Compounding the downward momentum, market participants continued to reprice global demand expectations against a backdrop of subdued macroeconomic indicators and recent demand forecast downgrades from major energy agencies. While underlying physical inventories remain structurally constrained, the near-term supply-demand balance softened as market focus shifted back toward lackluster industrial activity in major importing regions and ongoing central bank policy restrictiveness. The temporary absence of new bullish catalysts allowed short-term macroeconomic headwinds to dominate daily price action.
From a technical and market structure perspective, the sell-off triggered stop-loss orders as prices breached key short-term moving averages, accelerating systematic and institutional selling. Despite the sharp pullback, the forward crude curve maintains a notable backwardation structure, reflecting persistent tightness in spot supply and low visible inventory levels. Institutional investors remain focused on headline risks surrounding diplomatic developments, shipping bottlenecks, and upcoming inventory reports to gauge whether the current price adjustment represents a temporary volatility event or a broader rebalancing of the market strip.
Technical Analysis of WTI (USOIL)
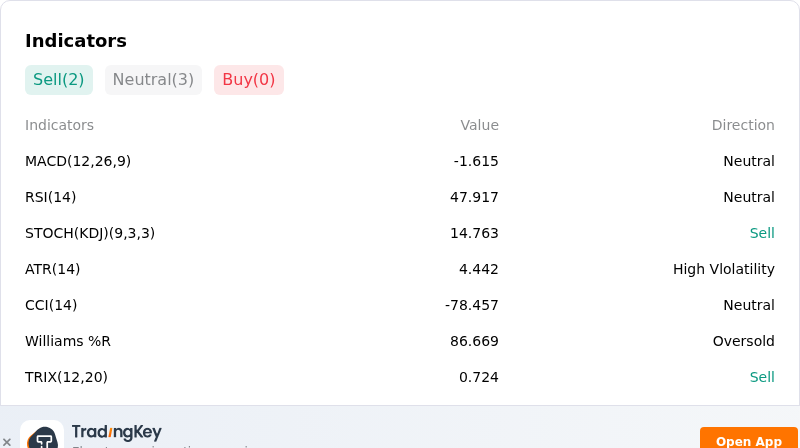
Technically, WTI (USOIL) shows a MACD (12,26,9) value of -1.615, indicating a neutral signal. The RSI at 47.917 suggests neutral condition and the Williams %R at 86.669 suggests oversold condition. Please monitor closely.
More details about WTI (USOIL)
Recent Events and Risks:
- Easing Middle East Supply Bottlenecks: Reports from U.S. military command indicating that crude oil flows through the Strait of Hormuz have recovered to multi-month highs, combined with Saudi Arabia utilizing alternative bypass routes, have significantly diminished physical disruption concerns and triggered a sharp unwind of geopolitical supply risk premiums.
- U.S.-Iran Diplomatic De-escalation Momentum: Active Qatari-led diplomatic mediation aimed at resuming formal talks between Washington and Tehran has fueled market expectations of a near-term geopolitical de-escalation, spurring heavy long-position liquidations across benchmark crude futures.
- Accelerating Global Fuel Demand Destruction: Major institutional assessments from the IEA and bank strategists warn that prolonged high fuel costs are destroying consumption, leading to severe downward revisions in global demand growth for middle distillates and Asian petrochemical feedstocks.
- Slowing Inventory Drawdowns and High U.S. Output: Market data reveals that the rate of global visible crude inventory draws has slowed markedly, while U.S. domestic production remains near record levels at roughly 13.9 million barrels per day alongside rising active rig counts, increasing downside fundamental pressure.
This article may include AI-generated content that is human-reviewed, which is for reference and general information purposes only and does not constitute investment advice.
Recommended Articles







Comments (0)
Click the $ button, enter the symbol, and select to link a stock, ETF, or other ticker.