


Solana (SOLUSD) Is up 12.18% on Sep 19: Why It Happened



Solana (SOLUSD) is up 12.18% at Sep 19 20:05(ET), now at $112.5, with a 7-day up of 12.09%.
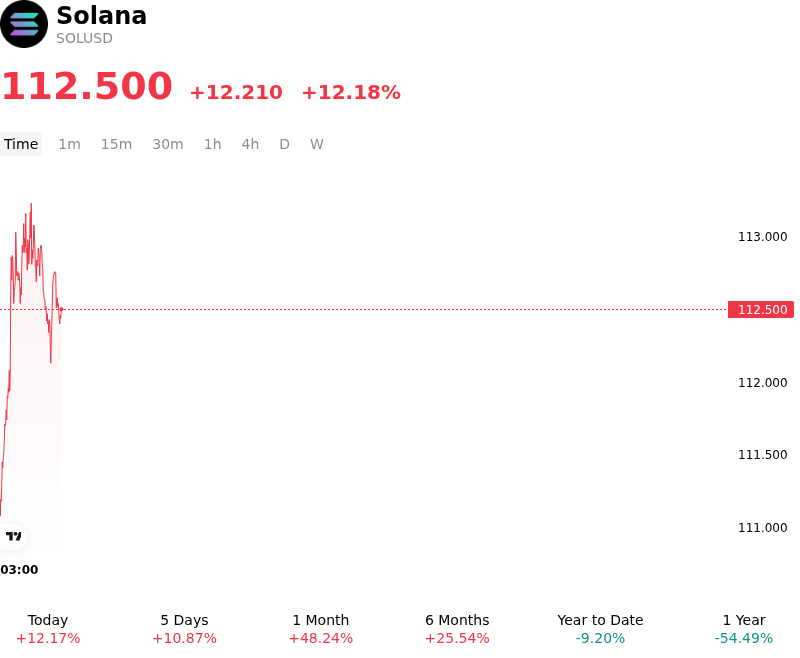
What is driving Solana (SOLUSD)’s stock price up today?
Solana experienced strong capital inflows driven by a combination of network performance upgrades, expanding institutional vehicle backing, and favorable regulatory developments. A key fundamental catalyst was the successful mainnet activation under protocol proposal SIMD-0525, which reduced target slot times from 300 to 250 milliseconds. By significantly lowering confirmation latency and increasing transaction frequency, the upgrade directly enhanced the network's execution capabilities for high-frequency decentralized applications. The smooth implementation of this scaling milestone fortified investor confidence in Solana's infrastructure roadmap, triggering a noticeable surge in decentralized exchange trading volumes and protocol fee generation.
Investor sentiment across high-beta digital assets was further bolstered by macro-regulatory tailwinds in the United States. The Securities and Exchange Commission issued an Innovation Exemption permitting Tokenized Securities Venues to trade tokenized equities through permissioned automated market maker pools. Institutional traders interpreted this framework as a long-term catalyst for high-throughput Layer-1 blockchains, positioning Solana as a key contender to host tokenized real-world asset trading and settlement layers. At the same time, news that the Commodity Futures Trading Commission submitted updated digital asset guidance to the White House helped mitigate market anxiety surrounding federal oversight. This improving backdrop coincided with continued capital accumulation in spot Solana fund products, with global assets under management ascending past $1.4 billion.
From a market structure and positioning standpoint, the upward trajectory was accelerated by short covering and leverage dynamics in crypto derivatives markets. As the price decisively breached technical resistance levels near key psychological thresholds, forced liquidations of leveraged short positions initiated a rapid short squeeze. The resulting buy-side momentum sparked a sharp expansion in futures open interest, accompanied by capital rotation into major ecosystem decentralized finance tokens. Although short-term technical indicators signal potential overbought conditions on lower timeframes, the rally reflects a structural realignment of capital supported by protocol execution, regulatory progression, and steady institutional engagement.
Technical Analysis of Solana (SOLUSD)
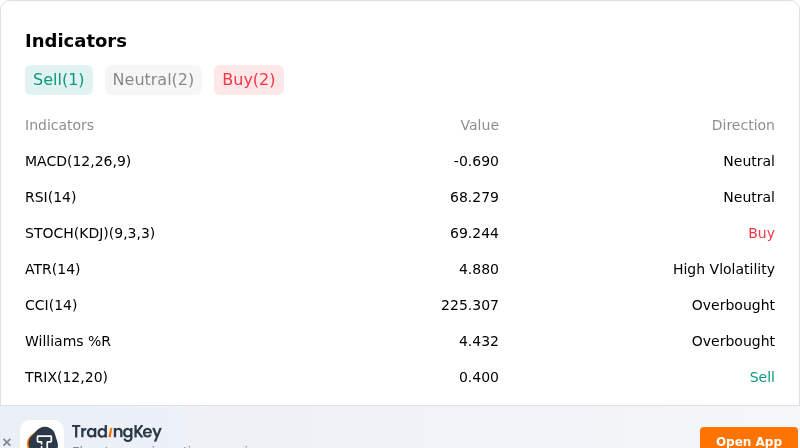
Technically, Solana (SOLUSD) shows a MACD (12,26,9) value of -0.690, indicating a neutral signal. The RSI at 68.279 suggests neutral condition and the Williams %R at 4.432 suggests overbought condition. Please monitor closely.
More details about Solana (SOLUSD)
Recent Events and Risks:
- Leverage Unwinds and Liquidation Cascades: Derivatives open interest in SOL remains vulnerable to sharp flushes, as hundreds of millions of dollars in market-wide long positions were liquidated in recent sessions, amplifying short-term price pressure on high-beta altcoins.
- U.S. Regulatory and Legislative Setbacks: Broader crypto sentiment turned risk-off following a Senate deadlock over the CLARITY Act, triggering aggressive profit-taking and sentiment degradation across top layer-1 networks like Solana.
- Crucial Technical Support Breakdown Risk: SOL is testing key support in the $97.70–$100.00 region; a decisive daily close below this heavy cost-basis shelf threatens to trigger technical stop-losses down toward secondary support near $90.00.
- On-Chain Supply Pressure and Institutional Cooling: Recurring exchange deposits by unstaking whales and ecosystem treasuries, alongside a slowdown in institutional ETF net inflows compared to late-August peaks, continue to create persistent overhead selling pressure.
This article may include AI-generated content that is human-reviewed, which is for reference and general information purposes only and does not constitute investment advice.
Recommended Articles










Comments (0)
Click the $ button, enter the symbol, and select to link a stock, ETF, or other ticker.