


Pershing Square Ord Shs Stock (PS) Moved Up by 9.47% on Sep 18: A Full Analysis



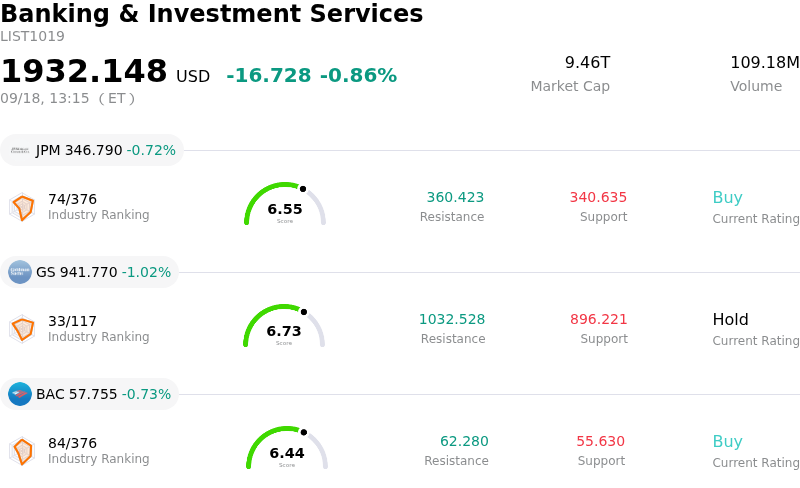
Pershing Square Ord Shs (PS) moved up by 9.47%. The Banking & Investment Services sector is down by 0.86%. The company outperformed the industry. Top 3 stocks by turnover in the sector: JPMorgan Chase & Co (JPM) down 0.72%; Goldman Sachs Group Inc (GS) down 1.02%; Bank of America Corp (BAC) down 0.73%.
What is driving Pershing Square Ord Shs (PS)’s stock price up today?
Pershing Square Inc. experienced strong buying momentum during the session, driven by a combination of key corporate cash flow events, portfolio updates, and favorable analyst commentary. A major short-term driver was the official distribution date of the fund's third-quarter dividend. The scheduled payout, along with associated automated open-market share purchases through the company's dividend reinvestment program, generated structural buy-side demand, supporting upward price action throughout the trading day.
In addition to dividend-related inflows, heightened market interest around the firm's public portfolio updates fueled bullish sentiment. Investors responded positively to recent regulatory filings and commentary detailing high-conviction strategic realignments, including expanded stakes in mega-cap software and cloud leaders alongside fresh entries into top-tier payment processing and media companies. These portfolio disclosures reaffirmed confidence in the manager's ability to capitalize on valuation dislocations and generate resilient capital growth.
Wall Street analyst revisions further bolstered investor enthusiasm. Recent price target increases and constructive research notes from major investment banks have drawn attention to the fund's earnings outperformance and narrowing discount relative to its underlying net asset value. Combined with broader stability across alternative asset managers, these positive operational catalysts and institutional reinvestment dynamics provided a compelling foundation for the stock's significant intraday advance.
Technical Analysis of Pershing Square Ord Shs (PS)
Technically, Pershing Square Ord Shs (PS) shows a MACD (12,26,9) value of 1.257, indicating a buy signal. The RSI at 68.568 suggests neutral condition and the Williams %R at 2.460 suggests overbought condition. Please monitor closely.
Fundamental Analysis of Pershing Square Ord Shs (PS)
Pershing Square Ord Shs (PS) is in the Banking & Investment Services industry. Its latest annual revenue is $348.77M, ranking 86 in the industry. The net profit is $249.78M, ranking 54 in the industry. Company Profile
Over the past month, multiple analysts have rated the company as Hold, with an average price target of $42.78, a high of $53.00, and a low of $36.00.
More details about Pershing Square Ord Shs (PS)
Company Specific Risks:
- Stretched Valuation Premium: Trading at an elevated trailing price-to-earnings multiple well above sector averages, the stock faces valuation resistance following price target adjustments and neutral ratings from institutional analysts at firms such as Citigroup and Wells Fargo.
- Concentrated Equity Exposure: With a significant proportion of the fund's assets concentrated in just four top equity holdings, negative intraday movements or operational setbacks in any single major position directly trigger heightened volatility for the stock.
- Net Asset Value Decline and Financial Losses: Financial disclosures highlighted an 8.1% decline in Net Asset Value alongside a quarterly net loss of $42.7 million, creating lingering market concern regarding the stability of underlying investment returns.
- Elevated Dividend Payout Ratio: The company's current dividend payout ratio substantially exceeds short-term reported earnings, leaving ongoing distributions exposed to investment realization cycles and discretionary board adjustments.
This article may include AI-generated content that is human-reviewed, which is for reference and general information purposes only and does not constitute investment advice.
Recommended Articles







Comments (0)
Click the $ button, enter the symbol, and select to link a stock, ETF, or other ticker.