


T-Mobile US Inc Stock (TMUS) Moved Down by 3.09% on Sep 17: What Signal Does It Send?



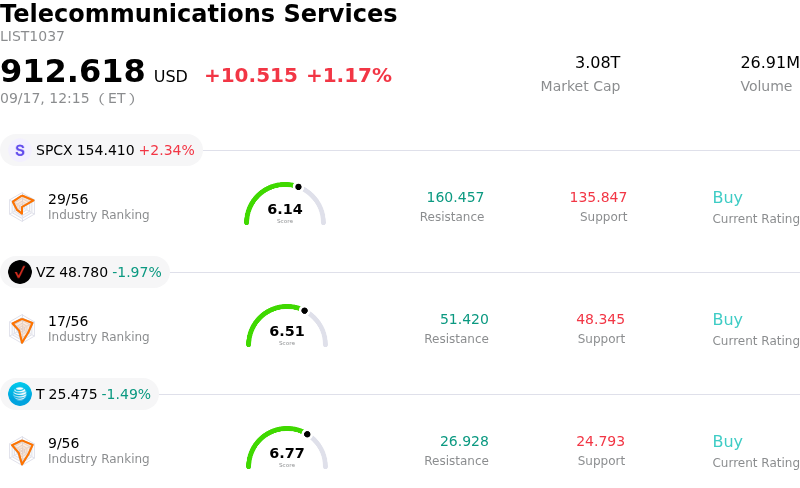
T-Mobile US Inc (TMUS) moved down by 3.09%. The Telecommunications Services sector is up by 1.17%. The company underperformed the industry. Top 3 stocks by turnover in the sector: SpaceX (SPCX) up 2.39%; Verizon Communications Inc (VZ) down 1.97%; AT&T Inc (T) down 1.47%.
What is driving T-Mobile US Inc (TMUS)’s stock price down today?
T-Mobile US experienced downward pressure and heightened intraday volatility, primarily driven by a mix of operational headwinds, industry competition, and technical selling. Recent channel updates indicate that aggressive promotional counter-moves from major telecom rivals are tempering subscriber growth momentum and creating friction around second-half average revenue per account expectations. Additionally, security disclosures regarding critical vulnerabilities in certain 5G home internet router models have drawn institutional scrutiny, raising short-term operational and technical concerns surrounding the carrier's fixed wireless broadband segment.
Market sentiment also remains sensitive as investors continue to evaluate recent leadership updates, including the announced transition plan for the Chief Financial Officer. While structured executive succession planning is typical for large-cap operators, leadership shifts occurring alongside heightened competitive dynamics can introduce temporary friction regarding future guidance and strategic positioning. Recent insider stock transactions and general drag across telecommunications equities further weighed on market sentiment during the session.
From a technical perspective, the stock experienced heightened trading activity as selling pressure tested key moving average support levels. With shares fluctuating near established short-term technical ranges, market participants are exercising caution ahead of upcoming quarterly earnings releases. While the company retains a strong underlying balance sheet and network advantage, elevated industry competition and sector-wide sentiment shifts continue to drive near-term price swings.
Technical Analysis of T-Mobile US Inc (TMUS)
Technically, T-Mobile US Inc (TMUS) shows a MACD (12,26,9) value of -1.884, indicating a neutral signal. The RSI at 37.725 suggests neutral condition and the Williams %R at 100.000 suggests oversold condition. Please monitor closely.
Fundamental Analysis of T-Mobile US Inc (TMUS)
T-Mobile US Inc (TMUS) is in the Telecommunications Services industry. Its latest annual revenue is $88.31B, ranking 4 in the industry. The net profit is $10.99B, ranking 4 in the industry. Company Profile
Over the past month, multiple analysts have rated the company as Buy, with an average price target of $242.11, a high of $310.00, and a low of $169.00.
More details about T-Mobile US Inc (TMUS)
Company Specific Risks:
- Executive Transition Uncertainty: Recent SEC Form 8-K filings detail a significant finance leadership transition, with Chief Financial Officer Peter Osvaldik retiring and Jessica Uhl appointed as CFO Designate. Coming within the CEO's first year, this executive succession introduces operational uncertainty and key-person risk during a crucial operational phase.
- Intensifying Price Competition and Subscriber Churn: Key competitors AT&T and Verizon have launched aggressive entry-level price plans that undercut T-Mobile's core budget tiers, prompting institutional analyst concerns over rising third-quarter subscriber churn and decelerating postpaid account growth as T-Mobile shifts toward higher-priced premium plans.
- Rising Capital Outlays for Broadband and AI Infrastructure: Escalating capital expenditures required for fixed wireless access, fiber network expansion, and physical AI infrastructure development—alongside upcoming spectrum auction obligations—threaten to squeeze profit margins and slow the pace of capital returns to shareholders.
- Premium Valuation Exposure to Rate Volatility: Trading at a premium enterprise multiple relative to direct telecom peers, T-Mobile faces heightened valuation compression risk and institutional profit-taking as broader macroeconomic interest rate adjustments favor lower-multiple defensive equities.
This article may include AI-generated content that is human-reviewed, which is for reference and general information purposes only and does not constitute investment advice.
Recommended Articles







Comments (0)
Click the $ button, enter the symbol, and select to link a stock, ETF, or other ticker.