


AT&T Inc Stock (T) Closed Down by 3.22% on Sep 16: Key Drivers Unveiled



AT&T Inc (T) closed down by 3.22%. The Telecommunications Services sector is up by 2.46%. The company underperformed the industry. Top 3 stocks by turnover in the sector: SpaceX (SPCX) up 5.15%; Verizon Communications Inc (VZ) down 3.28%; AT&T Inc (T) down 3.22%.
What is driving AT&T Inc (T)’s stock price down today?
The downward movement and intraday volatility in AT&T shares reflect a confluence of macroeconomic pressure and sector-specific repositioning. As a capital-intensive telecommunications provider, AT&T remains sensitive to broader macroeconomic shifts, particularly fluctuations in long-term Treasury yields and interest rate expectations. When bond yields rise or fixed-income alternatives become more competitive, high-yielding defensive sectors often face portfolio rebalancing and profit-taking from yield-oriented institutional investors, putting downward pressure on equities in the telecom space.
Beyond top-level macro headwinds, competitive dynamics in the wireless and broadband sectors continue to weigh on market sentiment. AT&T is actively expanding its fiber footprint and 5G network coverage, while concurrently pursuing strategic partnerships in satellite connectivity to counter prospective market share pressure from low-Earth orbit satellite operators. However, maintaining heavy capital expenditure programs to support infrastructure modernization alongside competitive wireless promotion cycles keeps investor focus trained on return on invested capital and free cash flow durability.
Capital allocation strategies have also contributed to shifting investor sentiment. AT&T has increasingly directed a larger share of its discretionary cash flow toward expanded share repurchases alongside its established dividend commitments. While share buybacks underscore management's confidence that the equity is undervalued, this prioritization of stock repurchases over immediate dividend growth creates varying reactions between income-focused traditional holders and institutional value managers, amplifying trading volatility during broader market pullbacks.
Looking ahead, AT&T retains strong baseline subscriber cash flows and reasonable valuation multiples relative to historical averages. Nevertheless, near-term share performance remains tied to overall market volatility, interest rate direction, and the company's ability to demonstrate ongoing operating leverage as legacy wireline infrastructure is phased out in favor of high-margin fiber and advanced wireless services.
Technical Analysis of AT&T Inc (T)
Technically, AT&T Inc (T) shows a MACD (12,26,9) value of -0.093, indicating a neutral signal. The RSI at 55.584 suggests neutral condition and the Williams %R at 50.117 suggests neutral condition. Please monitor closely.
Media Coverage of AT&T Inc (T)
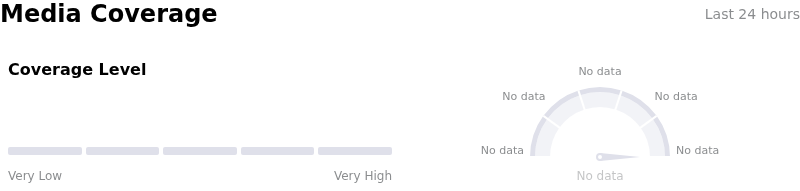
In terms of media coverage, AT&T Inc (T) shows a coverage score of 81, indicating a very high level of media attention. The overall market sentiment index is currently in bearish zone.
Fundamental Analysis of AT&T Inc (T)
AT&T Inc (T) is in the Telecommunications Services industry. Its latest annual revenue is $125.65B, ranking 2 in the industry. The net profit is $21.89B, ranking 1 in the industry. Company Profile
Over the past month, multiple analysts have rated the company as Buy, with an average price target of $28.43, a high of $36.00, and a low of $20.00.
More details about AT&T Inc (T)
Company Specific Risks:
- Fiber ARPU Compression and Bundling Margins: AT&T faces near-term downward pressure on Fiber Average Revenue Per User (ARPU) driven by the absorption of lower-priced subscriber accounts from Lumen and heightened promotional discounting across converged wireless and broadband packages.
- Leverage Expansion from Spectrum Acquisition: The closing of the $23 billion EchoStar spectrum license acquisition escalates net debt leverage, with net debt-to-adjusted EBITDA expected to expand from 2.68x to approximately 3.2x on a total net debt burden exceeding $125 billion.
- Intensive Capital Expenditure Drag on Cash Flow: Sustained annual capital investments projected between $23 billion and $24 billion for 5G network upgrades and fiber footprint expansion place continuous pressure on near-term free cash flow growth.
- Secular Wireline Decline and Emerging Satellite Competition: Ongoing revenue deterioration in legacy Business Wireline segments, combined with expanding satellite broadband alternatives like SpaceX's Starlink in rural and underserved markets, risks capping pricing power and accelerating traditional line losses.
This article may include AI-generated content that is human-reviewed, which is for reference and general information purposes only and does not constitute investment advice.
Recommended Articles








Comments (0)
Click the $ button, enter the symbol, and select to link a stock, ETF, or other ticker.