


EOG Resources Inc Stock (EOG) Moved Down by 5.13% on Sep 16: Drivers Behind the Movement



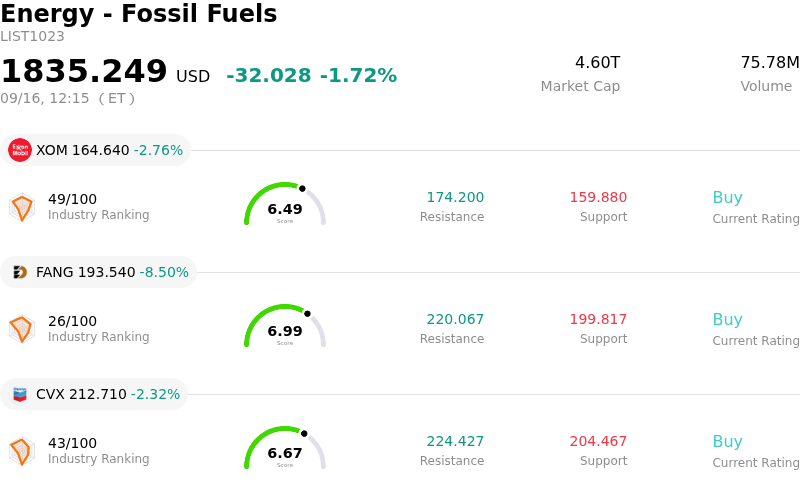
EOG Resources Inc (EOG) moved down by 5.13%. The Energy - Fossil Fuels sector is down by 1.72%. The company underperformed the industry. Top 3 stocks by turnover in the sector: Exxon Mobil Corp (XOM) down 2.76%; Diamondback Energy Inc (FANG) down 8.41%; Chevron Corp (CVX) down 2.32%.
What is driving EOG Resources Inc (EOG)’s stock price down today?
EOG Resources experienced downward pressure as crude oil benchmark prices retreated from recent highs. A key driver behind the weakness in energy commodities was an unexpected accumulation in U.S. crude oil inventories according to recent industry inventory reports. Additionally, market anxiety regarding Middle Eastern supply constraints eased after official statements indicated that operational disruptions in key regional transport infrastructure would likely be resolved sooner than initially feared. Lower crude prices directly weigh on realization rates for pure-play upstream operators, triggering a sector-wide decline across exploration and production equities.
Broader macroeconomic headwinds further amplified the downside momentum for capital-intensive energy stocks. Investor sentiment remained cautious ahead of a crucial Federal Reserve monetary policy decision, as elevated benchmark interest rates and persistent inflationary pressures heightened concerns over global economic expansion and oil demand growth. Rising Treasury yields across the financial markets prompted risk-off positioning, encouraging market participants to trim exposure to cyclical assets and energy producers that had delivered strong gains over preceding sessions.
From a company-specific perspective, the retracement reflects profit-taking following a multi-month rally that pushed EOG Resources toward new highs. EOG remains a premier upstream producer recognized for low supply costs, top-tier capital efficiency, and strong free cash flow generation across core domestic basins and expanding international projects. However, after a period of significant outperformance and recent corporate insider sales, near-term traders moved to lock in profits amidst softening spot commodity prices. EOG's underlying business fundamentals and disciplined capital allocation framework remain intact, though short-term stock performance will continue to mirror broader commodity market volatility.
Technical Analysis of EOG Resources Inc (EOG)
Technically, EOG Resources Inc (EOG) shows a MACD (12,26,9) value of -0.087, indicating a neutral signal. The RSI at 49.302 suggests neutral condition and the Williams %R at 73.947 suggests sell condition. Please monitor closely.
Fundamental Analysis of EOG Resources Inc (EOG)
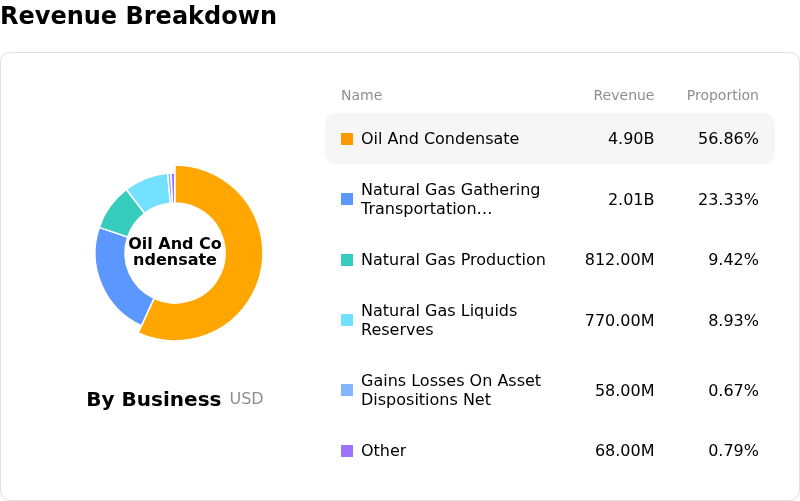
EOG Resources Inc (EOG) is in the Energy - Fossil Fuels industry. Its latest annual revenue is $22.65B, ranking 24 in the industry. The net profit is $4.98B, ranking 10 in the industry. Company Profile
Over the past month, multiple analysts have rated the company as Buy, with an average price target of $160.20, a high of $193.00, and a low of $113.00.
More details about EOG Resources Inc (EOG)
Company Specific Risks:
- Valuation Resistance and Capped Analyst Price Targets: Trading near 52-week highs around $153.74, EOG's stock price has caught up to or exceeded several key institutional price targets, including Barclays ($147), Citi ($150), and Goldman Sachs ($151), limiting near-term upside and leaving the stock vulnerable to profit-taking without continuous commodity price increases.
- Persistent Executive Insider Share Sales: Recent Form 4 filings reveal ongoing insider liquidation, including Chief Executive Officer Ezra Yacob selling 35,942 shares for $5.47 million at $152.10 alongside sales by EVP and Chief Legal Officer Michael Donaldson, raising concerns over executive sentiment regarding stock performance at current record levels.
- Surging Downside Options Hedging and Put Volatility: Recent options flow data shows institutional positioning shifting toward downside protection, highlighted by a surge in long-dated bear put spreads ($120/$150 strikes) and an elevated 90/110 option volatility skew, signaling rising institutional anxiety over a potential correction in energy equities.
- Execution and Capital Expenditure Pressures in Expansion Assets: Management's strategy presentations at the Barclays Energy Conference highlighted high capital spend commitments ($6.3 billion to $6.7 billion full-year capex) and operational integration demands across acquired Utica and Dorado assets, exposing cash flow to cost inflation and execution risks if operational output fails to meet aggressive 14% production growth targets.
This article may include AI-generated content that is human-reviewed, which is for reference and general information purposes only and does not constitute investment advice.
Recommended Articles








Comments (0)
Click the $ button, enter the symbol, and select to link a stock, ETF, or other ticker.