


Morgan Stanley Stock (MS) Moved Down by 4.17% on Sep 14: A Full Analysis



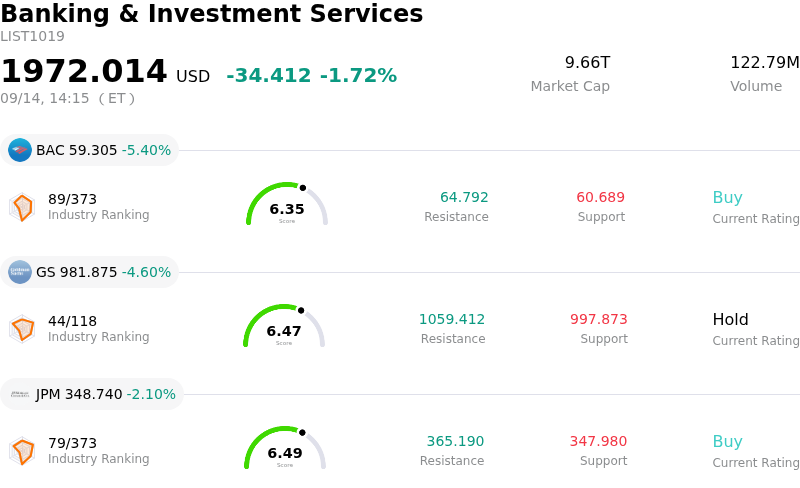
Morgan Stanley (MS) moved down by 4.17%. The Banking & Investment Services sector is down by 1.72%. The company underperformed the industry. Top 3 stocks by turnover in the sector: Bank of America Corp (BAC) down 5.46%; Goldman Sachs Group Inc (GS) down 4.60%; JPMorgan Chase & Co (JPM) down 2.18%.
What is driving Morgan Stanley (MS)’s stock price down today?
Morgan Stanley experienced a sharp downward pullback as broader market headwinds and surging benchmark Treasury yields dampened investor appetite across the financial sector. Heading into the Federal Reserve policy meeting, persistent inflation metrics and elevated crude oil prices renewed concerns that interest rates could remain restrictive for an extended period. The surge in long-term Treasury yields tightened financial conditions and prompted market participants to scale back risk exposure in large-cap financial institutions and rate-sensitive capital market firms.
From a fundamental and technical perspective, elevated broad-market volatility and risk-off sentiment created significant pressure on investment banking and asset management franchises. Following strong performance in preceding months, the stock faced heightened profit-taking as short-term technical indicators softened. Ongoing macroeconomic uncertainty, potential drains on corporate liquidity from elevated energy costs, and persistent geopolitical tensions continue to weigh on market sentiment, raising temporary questions regarding the pace of global dealmaking, debt underwriting, and wealth management asset inflows.
Despite the intraday pressure, Morgan Stanley retains a solid balance sheet, strong liquidity position, and high-quality wealth management platform capable of generating durable fee income. However, near-term stock performance will remain closely tethered to Federal Reserve policy signals, yield curve shifts, and overall equity market stability. Institutional investors will be closely watching upcoming policy guidance and corporate advisory activity for signs of revenue stabilization in the core investment banking and trading divisions.
Technical Analysis of Morgan Stanley (MS)
Technically, Morgan Stanley (MS) shows a MACD (12,26,9) value of -1.185, indicating a sell signal. The RSI at 38.076 suggests neutral condition and the Williams %R at 93.789 suggests oversold condition. Please monitor closely.
Media Coverage of Morgan Stanley (MS)
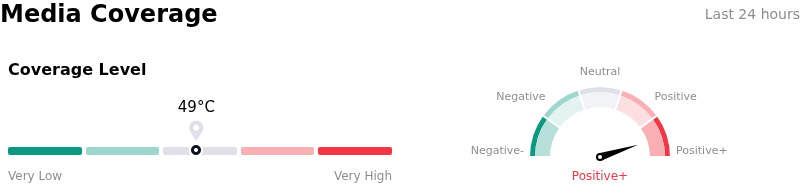
In terms of media coverage, Morgan Stanley (MS) shows a coverage score of 49, indicating a moderate level of media attention. The overall market sentiment index is currently in extremely bullish zone.
Fundamental Analysis of Morgan Stanley (MS)
Morgan Stanley (MS) is in the Banking & Investment Services industry. Its latest annual revenue is $114.74B, ranking 3 in the industry. The net profit is $16.25B, ranking 2 in the industry. Company Profile
Over the past month, multiple analysts have rated the company as Buy, with an average price target of $241.94, a high of $262.00, and a low of $200.00.
More details about Morgan Stanley (MS)
Company Specific Risks:
- Valuation Compression Risk: Morgan Stanley's elevated price-to-book valuation of over 3.2x—representing a steep premium above financial sector peers—leaves the stock vulnerable to sharp multiple contraction during broader market volatility.
- Wealth Management Asset Flow Deceleration: Recent moderation in fee-based asset inflows within Wealth Management and softer long-term net flows in Investment Management create top-line risks for high-margin recurring revenues if client risk aversion increases.
- Institutional Revenue Sensitivity to Capital Market Slowdown: Potential market liquidity drains caused by persistent energy price spikes and tight financial conditions threaten to stall M&A dealmaking, corporate debt issuance, and underwriting activity, directly impacting Institutional Securities earnings.
- Credit and Fixed Income Portfolio Exposure: Sustained elevated borrowing costs and tight economic conditions increase corporate default risks, potentially straining the firm's corporate debt holdings and requiring higher credit loss provisions.
This article may include AI-generated content that is human-reviewed, which is for reference and general information purposes only and does not constitute investment advice.
Recommended Articles








Comments (0)
Click the $ button, enter the symbol, and select to link a stock, ETF, or other ticker.