


Ge Vernova Inc Stock (GEV) Moved Down by 8.78% on Sep 14: What Signal Does It Send?



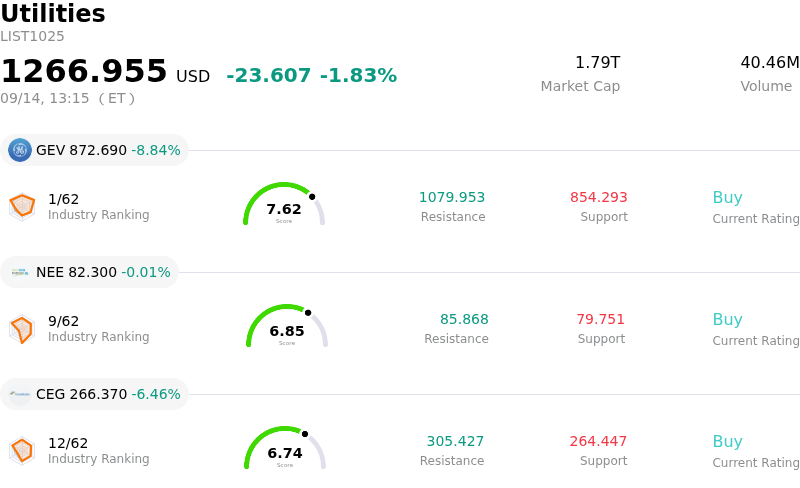
Ge Vernova Inc (GEV) moved down by 8.78%. The Utilities sector is down by 1.83%. The company underperformed the industry. Top 3 stocks by turnover in the sector: Ge Vernova Inc (GEV) down 8.84%; Nextera Energy Inc (NEE) down 0.01%; Constellation Energy Corp (CEG) down 6.46%.
What is driving Ge Vernova Inc (GEV)’s stock price down today?
GE Vernova experienced significant selling pressure driven primarily by a high-profile analyst initiation that directly challenged the market valuation of the power equipment leader. GLJ Research issued a Sell rating with a price target positioned substantially below prevailing trading levels. The research firm framed the company as a cyclical industrial manufacturer trading at an inflated valuation multiple typically reserved for secular growth compounders. Specific concerns were raised regarding execution risks, potential margin compression on future equipment deliveries, and the high proportion of uncommitted slot reservations compared to firm contracted backlogs within its gas power pipeline.
The negative analyst commentary triggered broader profit-taking across the entire AI-driven power infrastructure and grid equipment sector. Investors rotated out of high-momentum names heavily tied to data center electricity demand, as concerns over capital expenditure timelines and execution risks surfaced across the industry. Peer stocks in power management and grid construction also faced heightened volatility, compounding the downside pressure on GE Vernova as sector sentiment turned defensive.
From an institutional perspective, the pull-back highlights the growing sensitivity around valuation metrics for companies positioned in the artificial intelligence power supply chain. Having run up considerably on aggressive multi-year growth forecasts, the stock left minimal margin for error regarding profit margins and order conversion. Moving forward, institutional investors will be focused on the company's ability to convert non-binding slot reservations into high-margin firm orders while navigating potential cyclical headwinds in global power generation markets.
Technical Analysis of Ge Vernova Inc (GEV)
Technically, Ge Vernova Inc (GEV) shows a MACD (12,26,9) value of -1.441, indicating a sell signal. The RSI at 37.494 suggests neutral condition and the Williams %R at 96.040 suggests oversold condition. Please monitor closely.
Media Coverage of Ge Vernova Inc (GEV)
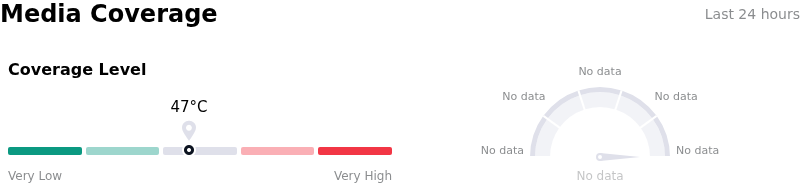
In terms of media coverage, Ge Vernova Inc (GEV) shows a coverage score of 47, indicating a moderate level of media attention. The overall market sentiment index is currently in extremely bullish zone.
Fundamental Analysis of Ge Vernova Inc (GEV)
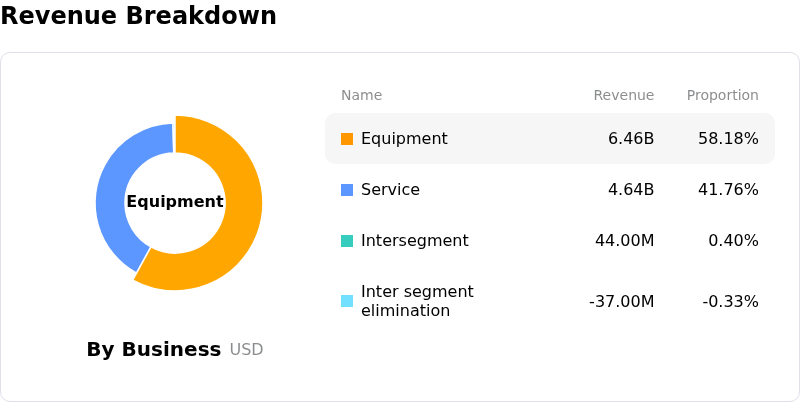
Ge Vernova Inc (GEV) is in the Utilities industry. Its latest annual revenue is $38.07B, ranking 2 in the industry. The net profit is $4.88B, ranking 4 in the industry. Company Profile
Over the past month, multiple analysts have rated the company as Buy, with an average price target of $1216.86, a high of $1450.00, and a low of $836.00.
More details about Ge Vernova Inc (GEV)
Company Specific Risks:
- Wall Street Downgrade and Deep Valuation Re-rating: GLJ Research initiated coverage on GE Vernova on September 14, 2026, with a "Sell" rating and a Wall Street-low price target of $470—representing a target 51% below prior closing levels—triggering an intraday stock drop of over 9% as analysts warned that GEV’s forward EV/EBITDA multiple misprices a cyclical turbine manufacturer as a secular growth compounder.
- 2027 Backlog Margin Compression and Earnings Headwinds: Contract timing analysis indicates that equipment scheduled for 2027 delivery was ordered in 2024 prior to recent price increases, resulting in projected backlog margins of roughly 3 percentage points for the 2027 vintage compared to 10–11 percentage points for later vintages. Consequently, GLJ's 2027 EBITDA estimate of $7.42 billion sits 22% below the Wall Street consensus of $9.45 billion.
- Competitive Disruption from Next-Gen Solar Capacity Expansion: Sector sentiment was further strained by announcements that SpaceX and Tesla plan to construct 100 gigawatts per year of solar manufacturing capacity, intensifying institutional concerns around long-term market share loss and structural demand erosion for traditional gas-turbine power infrastructure.
- Gas Turbine Market Oversupply and Peak-Cycle Normalization: Industry research highlighted growing risks of global gas turbine oversupply among primary manufacturers, reinforcing fears that current record order velocity and pricing power have peaked, which exposes GEV to accelerated multiple compression as utility equipment demand normalizes.
This article may include AI-generated content that is human-reviewed, which is for reference and general information purposes only and does not constitute investment advice.
Recommended Articles









Comments (0)
Click the $ button, enter the symbol, and select to link a stock, ETF, or other ticker.