


Dell Technologies Inc Stock (DELL) Moved Down by 6.85% on Sep 14: What Signal Does It Send?



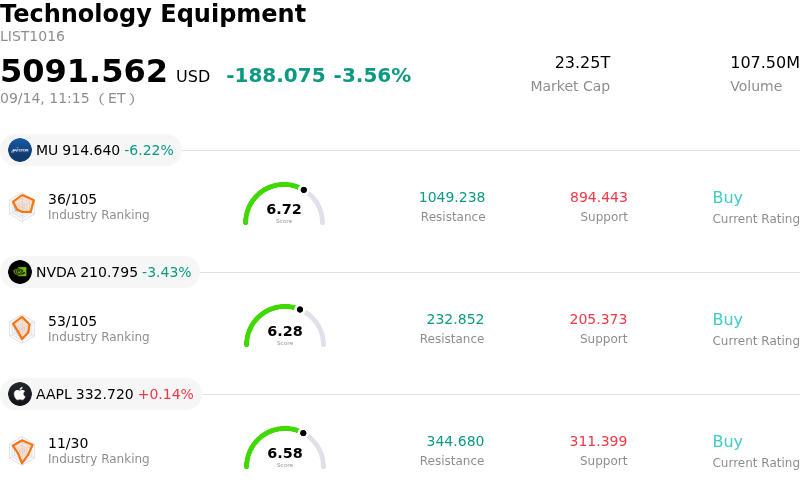
Dell Technologies Inc (DELL) moved down by 6.85%. The Technology Equipment sector is down by 3.56%. The company underperformed the industry. Top 3 stocks by turnover in the sector: Micron Technology Inc (MU) down 6.30%; NVIDIA Corp (NVDA) down 3.47%; Apple Inc (AAPL) up 0.13%.
What is driving Dell Technologies Inc (DELL)’s stock price down today?
Dell Technologies experienced a sharp downward retracement following a powerful multi-day rally that previously drove the stock to new all-time highs. After surging on the back of exceptional fiscal second-quarter financial results, upgraded full-year guidance, and robust commentary surrounding AI infrastructure demand, short-term momentum traders and institutional investors engaged in aggressive profit-taking. Having priced in significant optimism regarding the company's expanding AI server backlog and raised revenue outlook, the stock faced natural consolidation as market participants re-evaluated risk-reward dynamics at elevated valuation levels.
While Dell's overall operational trajectory remains anchored by extraordinary demand for AI-optimized servers and high-margin enterprise storage solutions, recent market discussions have increasingly focused on the profitability profile of AI hardware deployments. AI server shipments, despite driving massive top-line expansion, carry lower incremental operating conversion margins compared to Dell's traditional enterprise storage and client solutions. As the share price approached levels that fully reflect near-term backlog conversion, investors became more sensitive to potential margin dilution and the capital requirements necessary to sustain rapid data center buildouts.
Additional pressure was driven by recent disclosures regarding equity distribution and sales by major private equity sponsors under standard regulatory filings, adding incremental secondary market supply following the recent surge. Despite the intraday weakness, Dell's fundamental thesis remains supported by an extensive order book, accelerating enterprise adoption of AI compute, and favorable long-term position in next-generation IT infrastructure. In the near term, trading activity will likely hinge on market digestion of hardware margin trajectories and broader profit-taking trends across the technology sector.
Technical Analysis of Dell Technologies Inc (DELL)
Technically, Dell Technologies Inc (DELL) shows a MACD (12,26,9) value of 12.587, indicating a buy signal. The RSI at 58.142 suggests neutral condition and the Williams %R at 26.964 suggests buy condition. Please monitor closely.
Media Coverage of Dell Technologies Inc (DELL)
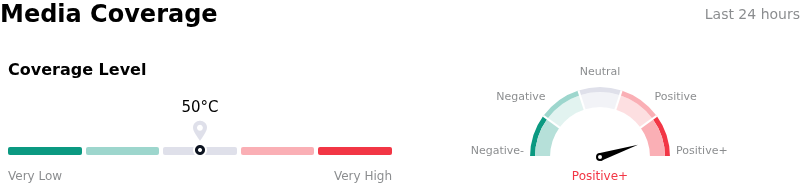
In terms of media coverage, Dell Technologies Inc (DELL) shows a coverage score of 50, indicating a moderate level of media attention. The overall market sentiment index is currently in extremely bullish zone.
Fundamental Analysis of Dell Technologies Inc (DELL)
Dell Technologies Inc (DELL) is in the Technology Equipment industry. Its latest annual revenue is $113.54B, ranking 2 in the industry. The net profit is $5.94B, ranking 4 in the industry. Company Profile
Over the past month, multiple analysts have rated the company as Buy, with an average price target of $570.91, a high of $700.00, and a low of $465.00.
More details about Dell Technologies Inc (DELL)
Company Specific Risks:
- Sponsor Share Dispositions and Insider Selling Pressure: SEC Form 144 filings submitted on September 11, 2026, disclosed planned share sales of Class C common stock by major private equity sponsor Silver Lake Partners IV, continuing a multi-week trend of multi-million-dollar equity liquidations that creates immediate institutional overhead pressure at elevated valuations.
- Free Cash Flow Divergence and Working Capital Drag: Recent post-earnings financial analyses highlight an increasing disconnect between accounting net income and cash conversion, as GAAP free cash flow fell approximately 77% short of Wall Street estimates to $986 million due to heavy inventory build and customer financing receivables required for large-scale AI server deployments.
- Gross Margin Dilution from Lower-Margin AI Hardware Mix: Analyst commentary emphasizes ongoing gross margin compression as the revenue mix shifts aggressively toward AI-optimized servers, which yield only mid-single-digit operating margins compared to Dell's historically higher-margin enterprise storage and PC businesses.
- Component Supply Shortages and Input Inflation: Ongoing supply constraints across high-bandwidth DRAM, NAND flash memory, advanced CPUs, and server components threaten near-term backlog fulfillment timelines while compounding cost inflation risks across Dell's hardware manufacturing network.
This article may include AI-generated content that is human-reviewed, which is for reference and general information purposes only and does not constitute investment advice.
Recommended Articles









Comments (0)
Click the $ button, enter the symbol, and select to link a stock, ETF, or other ticker.