


USD/JPY (USDJPY) Is up 0.51% on Sep 14: What Is Behind the Currency Move?



USD/JPY (USDJPY) is up 0.51% at Sep 14 03:20(ET), now at $154.324, with a 7-day down of 0.00%.
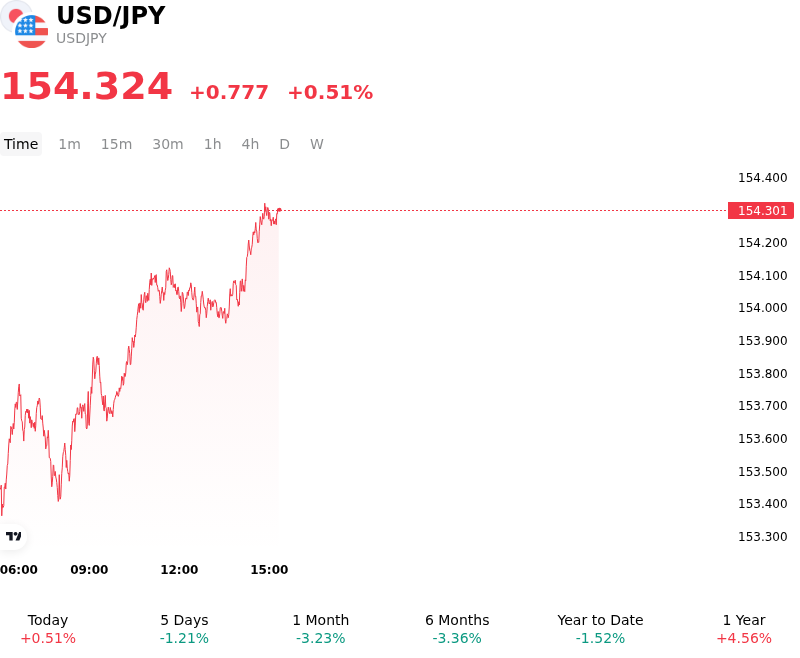
What is driving USD/JPY (USDJPY)’s stock price up today?
The upward movement in USD/JPY was primarily driven by a surge in U.S. Treasury yields and a hawkish repricing of Federal Reserve policy expectations ahead of key central bank decisions. Recent U.S. economic data, characterized by persistent underlying inflation and labor market resilience, bolstered market expectations for tighter monetary policy. The resulting rise in U.S. benchmark yields widened the yield differential between the United States and Japan, re-engaging yield-seeking institutional flows in favor of the dollar.
While the Bank of Japan is facing elevated domestic inflation pressures and markets had increasingly priced in an impending policy rate hike, much of the hawkish domestic outlook was already discounted by market participants. Consequently, the Japanese yen failed to derive fresh buying interest from local policy expectations. Additionally, positioning metrics indicated that speculative yen positions had stretched to net-long levels following recent sessions of yen strength, leaving the market prone to profit-taking and mean-reverting flows that fueled the dollar's rebound.
Macroeconomic dynamics surrounding energy markets also added structural headwinds for the yen. Elevated global crude oil prices reinforced U.S. inflation concerns—further supporting elevated U.S. yields—while simultaneously worsening Japan's trade balance due to its heavy reliance on imported commodities. Investors continue to monitor whether the persistent rate gap will maintain upward momentum for the pair or if explicit policy tightening and forward guidance from Japanese officials will cap long-term upside.
Technical Analysis of USD/JPY (USDJPY)
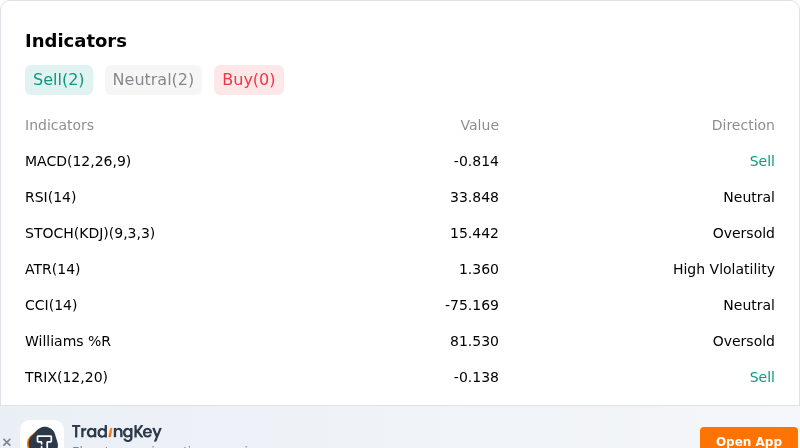
Technically, USD/JPY (USDJPY) shows a MACD (12,26,9) value of -0.814, indicating a sell signal. The RSI at 33.848 suggests neutral condition and the Williams %R at 81.530 suggests oversold condition. Please monitor closely.
More details about USD/JPY (USDJPY)
Recent Events and Risks:
- Hawkish BoJ Rate Hike Pricing: With the Bank of Japan policy meeting approaching, interest rate swap markets have fully priced in a 25 basis point rate hike and remain highly sensitive to hawkish policy guidance, threatening to lift Japanese bond yields and apply aggressive downside pressure on USD/JPY.
- Accelerating Yen Carry Trade Unwind: Sustained technical breakdowns below key medium-term support levels near 153.00 have triggered systematic stop-loss orders, driving rapid position recalibration and the forced liquidation of leveraged short-yen carry trades.
- Coordinated FX Intervention and Verbal Warnings: Recent joint policy signals and official warnings from Japanese Ministry of Finance authorities and the U.S. Treasury regarding exchange rate stability continue to create asymmetric downside risk, capping spot rallies and encouraging pre-emptive yen purchases.
- U.S. Yield Sensitivity and Rate Differential Compression: Volatility in front-end U.S. Treasury yields ahead of the upcoming FOMC rate decision poses severe downside risk for the pair, as any dovish repricing or treasury yield decline would rapidly narrow the U.S.-Japan rate differential and spark intraday dollar selling.
This article may include AI-generated content that is human-reviewed, which is for reference and general information purposes only and does not constitute investment advice.
Recommended Articles








Comments (0)
Click the $ button, enter the symbol, and select to link a stock, ETF, or other ticker.