


Advanced Micro Devices Inc Stock (AMD) Moved Down by 3.16% on Sep 10: Drivers Behind the Movement



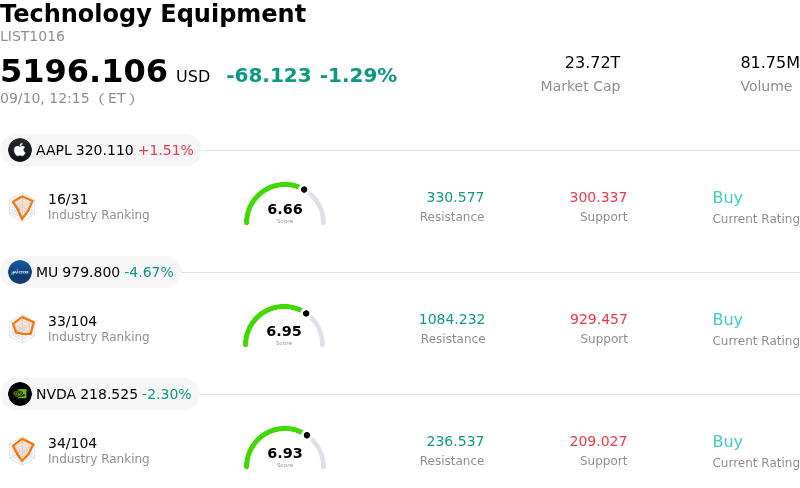
Advanced Micro Devices Inc (AMD) moved down by 3.16%. The Technology Equipment sector is down by 1.29%. The company underperformed the industry. Top 3 stocks by turnover in the sector: Apple Inc (AAPL) up 1.60%; Micron Technology Inc (MU) down 4.67%; NVIDIA Corp (NVDA) down 2.30%.
What is driving Advanced Micro Devices Inc (AMD)’s stock price down today?
Advanced Micro Devices experienced downward momentum as broad-based selling pressure across the semiconductor sector triggered a wave of profit-taking. Following a powerful multi-day rally propelled by optimistic long-term guidance, short-term traders and institutional market participants moved to lock in gains. The retreat mirrored broader sector trends, as chipmakers faced renewed pressure amid rising benchmark Treasury yields and a cautious macro environment, which historically weighs heavily on high-multiple growth stocks.
The pullback follows recent management commentary from the Citi Global TMT Conference, where executive leadership raised the company's long-term artificial intelligence addressable market projection and reiterated expectations for strong data center revenue growth through fiscal 2027. While these announcements initially spurred strong buying interest and technical breakouts, the market quickly pivoted to digesting the high valuation multiple embedded in shares after a substantial year-to-date run. High investor expectations create a low margin for error, prompting temporary consolidation when sector sentiment turns risk-off.
Fundamental considerations around supply chain logistics and execution timelines also contributed to the intraday volatility. Investors are scrutinizing the commercial ramp of next-generation AI hardware, including the Helios rack-scale platform and upcoming Instinct GPU deployments. Key variables such as advanced packaging availability, high-bandwidth memory supplies, and foundry capacity constraints remain critical parameters for maintaining growth trajectories. Consequently, institutional portfolio adjustments and tactical downside hedging led to downside pressure, even as long-term artificial intelligence tailwinds and structural market share gains in server processors remain intact.
Technical Analysis of Advanced Micro Devices Inc (AMD)
Technically, Advanced Micro Devices Inc (AMD) shows a MACD (12,26,9) value of 11.715, indicating a neutral signal. The RSI at 55.387 suggests neutral condition and the Williams %R at 25.634 suggests buy condition. Please monitor closely.
Media Coverage of Advanced Micro Devices Inc (AMD)
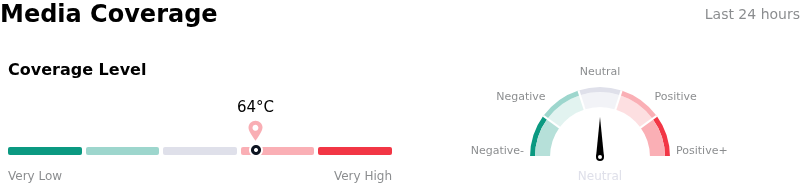
In terms of media coverage, Advanced Micro Devices Inc (AMD) shows a coverage score of 64, indicating a high level of media attention. The overall market sentiment index is currently in neutral zone.
Fundamental Analysis of Advanced Micro Devices Inc (AMD)
Advanced Micro Devices Inc (AMD) is in the Technology Equipment industry. Its latest annual revenue is $34.64B, ranking 9 in the industry. The net profit is $4.33B, ranking 12 in the industry. Company Profile
Over the past month, multiple analysts have rated the company as Buy, with an average price target of $603.63, a high of $1250.00, and a low of $320.00.
More details about Advanced Micro Devices Inc (AMD)
Company Specific Risks:
- Elevated Valuation and Execution Risk: AMD's forward earnings multiple exceeding 60x leaves the stock vulnerable to sharp pullbacks if execution on the upcoming Helios rack-scale AI platform or data-center chip deployments face any unexpected delays or yield bottlenecks.
- Aggressive Market Size Projections vs. Independent Research: Management's recent upward revision of its 2030 AI Total Addressable Market (TAM) to $3 trillion creates risk of long-term revenue shortfalls, as independent analyst estimates sit significantly lower between $1.2 trillion and $1.7 trillion.
- Software Moat and Competitive Disadvantage: Nvidia's entrenched CUDA software ecosystem continues to pose a significant hurdle to developer adoption, restricting AMD's ROCm platform from converting market opportunity into high-margin enterprise AI workload share.
- Negative Technical Divergence on Price Moves: Recent intraday pushes toward upper resistance levels ($520–$529) occurred alongside falling trading volume, creating a volume-price divergence that institutional technical analysts flag as heightened short-term reversal risk.
This article may include AI-generated content that is human-reviewed, which is for reference and general information purposes only and does not constitute investment advice.
Recommended Articles








Comments (0)
Click the $ button, enter the symbol, and select to link a stock, ETF, or other ticker.