


BHP Group Ltd Stock (BHP) Moved Down by 5.79% on Sep 10: What Signal Does It Send?



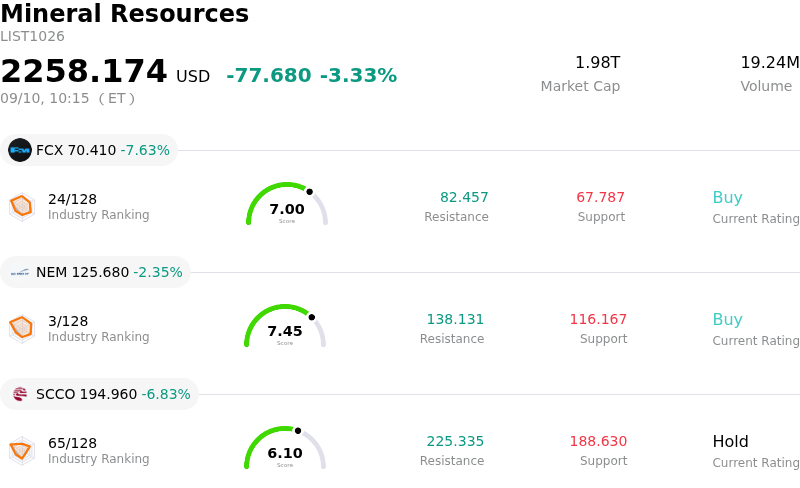
BHP Group Ltd (BHP) moved down by 5.79%. The Mineral Resources sector is down by 3.33%. The company underperformed the industry. Top 3 stocks by turnover in the sector: Freeport-McMoRan Inc (FCX) down 7.62%; Newmont Corporation (NEM) down 2.35%; Southern Copper Corp (SCCO) down 6.83%.
What is driving BHP Group Ltd (BHP)’s stock price down today?
The pull-back in BHP shares was primarily driven by weakness across bulk commodity markets, most notably a drop in iron ore benchmark prices below key support levels. Margin deterioration at major steel producers and lingering uncertainties surrounding industrial demand in China weighed heavily on bulk material valuations. Because iron ore represents a critical pillar of BHP's revenue base alongside copper, softening commodity prices triggered broad-based profit taking across the global metals and mining space.
Adding to the selling pressure, headline risk emerged from news that Australia's Mining and Energy Union initiated a class-action lawsuit against the company over public holiday employment practices. Although the long-term financial consequences of the suit remain uncertain, the potential for expanded labor liabilities and operational friction introduced an additional layer of near-term risk for institutional investors already sensitive to rising mining costs.
Furthermore, technical trading factors amplified the downside movement. Following BHP's recent ex-dividend date for its final dividend payout, institutional portfolio adjustments and dividend-capture unwinding typically induce secondary selling pressure. When combined with macroeconomic headwinds and falling underlying spot commodity prices, these flows resulted in heightened intraday volatility.
Looking ahead, while fundamental strength in BHP's expanding copper footprint and industry-leading cost curve provide long-term structural support, near-term stock performance will remain tightly linked to iron ore price stabilization, Chinese economic policy developments, and legal clarity surrounding domestic labor disputes.
Technical Analysis of BHP Group Ltd (BHP)
Technically, BHP Group Ltd (BHP) shows a MACD (12,26,9) value of -1.471, indicating a neutral signal. The RSI at 42.932 suggests neutral condition and the Williams %R at 97.233 suggests oversold condition. Please monitor closely.
Fundamental Analysis of BHP Group Ltd (BHP)
BHP Group Ltd (BHP) is in the Mineral Resources industry. Its latest annual revenue is $58.76B, ranking 2 in the industry. The net profit is $9.83B, ranking 2 in the industry. Company Profile
Over the past month, multiple analysts have rated the company as Hold, with an average price target of $75.92, a high of $91.00, and a low of $61.50.
More details about BHP Group Ltd (BHP)
Company Specific Risks:
- Iron Ore Benchmark Compression: Spot iron ore prices slipping below US$100 per tonne have directly pressured BHP's major earnings driver, triggering intraday selling as market participants re-evaluate short-term cash flow generation and operational margins.
- Chinese Procurement Friction and Regulatory Uncertainty: Directives from China Mineral Resources Group (CMRG) for domestic steel mills to pause purchasing talks for Pilbara iron ore blends have raised institutional concerns that BHP could face unexpected regulatory trade scrutiny or import delays in its primary market.
- Capital Execution and Project Inflation Vulnerabilities: Capital expenditure commitments alongside reported cost blowouts at the flagship Jansen Potash project in Canada continue to generate headwind risks regarding long-term capital allocation efficiency and return metrics.
- Institutional Rating Cautiousness and Valuation Cap: Following a extended rally, analyst sentiment remains constrained with a consensus "Hold" stance, driven by concerns over underlying commodity price volatility and limited near-term valuation upside.
This article may include AI-generated content that is human-reviewed, which is for reference and general information purposes only and does not constitute investment advice.
Recommended Articles







Comments (0)
Click the $ button, enter the symbol, and select to link a stock, ETF, or other ticker.