


Ge Vernova Inc Stock (GEV) Moved Up by 3.24% on Sep 8: Facts Behind the Movement



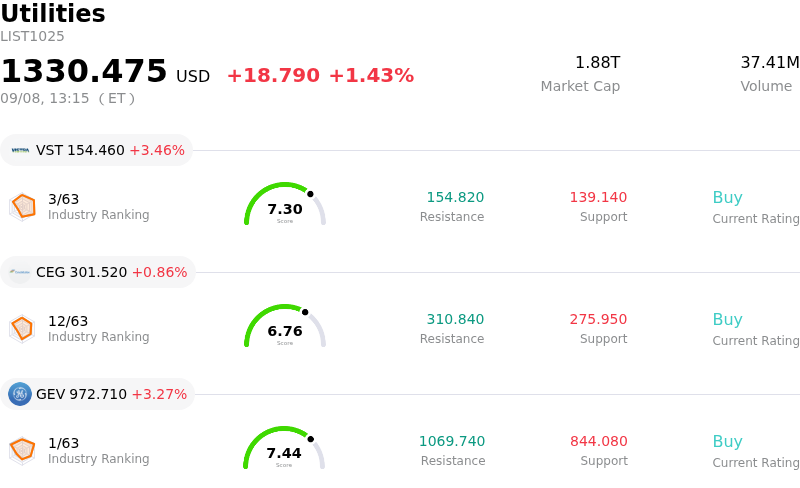
Ge Vernova Inc (GEV) moved up by 3.24%. The Utilities sector is up by 1.43%. The company outperformed the industry. Top 3 stocks by turnover in the sector: Vistra Corp (VST) up 3.46%; Constellation Energy Corp (CEG) up 0.86%; Ge Vernova Inc (GEV) up 3.27%.
What is driving Ge Vernova Inc (GEV)’s stock price up today?
GE Vernova experienced positive buying momentum as market sentiment surrounding power infrastructure and AI energy demand reinforced investor confidence. The stock benefited from renewed interest following a brief mid-summer consolidation, as investors re-evaluated the company's crucial position in enabling grid modernization and supplying gas turbines to power-hungry AI data centers. Institutional buying picked up as valuation narratives pointed to a favorable risk-reward setup relative to long-term analyst price targets.
Sustaining this positive trajectory is fundamental strength across the company's core operations. Investor sentiment has been supported by management's proactive corporate governance moves, including the recent CFO succession plan that ensures strategic continuity for the company's next phase of profitable growth. Furthermore, record order backlogs spanning power generation and electrification, alongside upwardly revised full-year revenue and free cash flow guidance, continue to reassure investors of durable revenue visibility extending over the coming years.
The intraday strength was further bolstered by steady commercial progress, exemplified by recent international contract wins across onshore wind energy and nuclear technology collaborations. As utilities and enterprise customers rush to secure power capacity and high-voltage grid technology, GE Vernova remains a primary beneficiary of structural electrification trends. Despite lingering volatility within the broader clean energy and industrial space, robust demand for the company's gas turbines and grid solutions continues to provide a strong operational floor and attract institutional support.
Technical Analysis of Ge Vernova Inc (GEV)
Technically, Ge Vernova Inc (GEV) shows a MACD (12,26,9) value of 3.717, indicating a neutral signal. The RSI at 50.423 suggests neutral condition and the Williams %R at 24.302 suggests buy condition. Please monitor closely.
Media Coverage of Ge Vernova Inc (GEV)
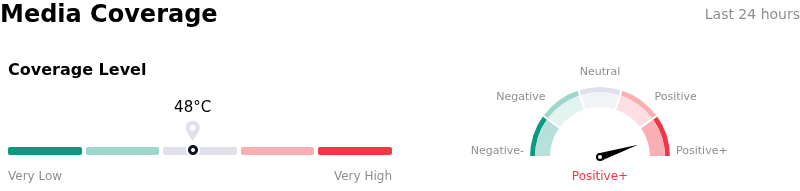
In terms of media coverage, Ge Vernova Inc (GEV) shows a coverage score of 48, indicating a moderate level of media attention. The overall market sentiment index is currently in extremely bullish zone.
Fundamental Analysis of Ge Vernova Inc (GEV)
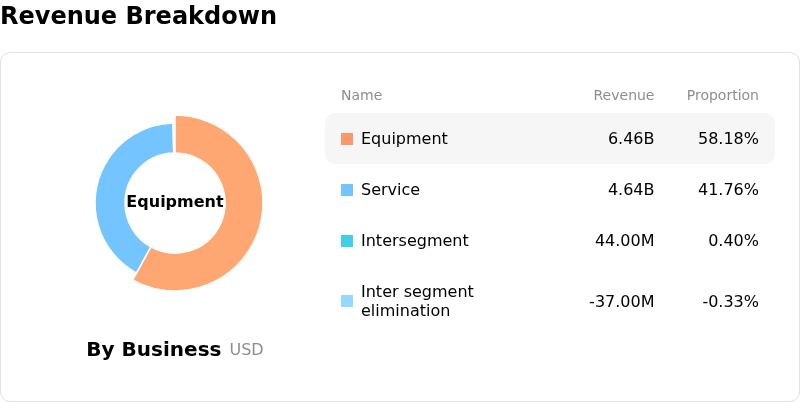
Ge Vernova Inc (GEV) is in the Utilities industry. Its latest annual revenue is $38.07B, ranking 2 in the industry. The net profit is $4.88B, ranking 4 in the industry. Company Profile
Over the past month, multiple analysts have rated the company as Buy, with an average price target of $1215.95, a high of $1450.00, and a low of $836.00.
More details about Ge Vernova Inc (GEV)
Company Specific Risks:
- CFO Leadership Transition: The announcement that Rivian CFO Claire McDonough will succeed long-serving CFO Kenneth Parks introduces management execution and strategy continuity risks during a key period of corporate scaling.
- Persistent Drag from Wind Division: GE Vernova's Wind segment continues to struggle with severe demand weakness and margin drag, highlighted by a 40% year-over-year decline in order bookings.
- Elevated Valuation and Wall Street Downgrades: Shares face profit-taking and multiple compression after falling over 20% from peak levels, driven by valuation concerns including a forward P/E ratio above 30x and institutional downgrades to Underweight.
- Backlog Conversion and EPS Misses: Recent financial performance included a bottom-line earnings miss ($2.47 per share vs. $3.17 expected), exposing operational bottleneck risks in converting its $176 billion backlog into net profit.
This article may include AI-generated content that is human-reviewed, which is for reference and general information purposes only and does not constitute investment advice.
Recommended Articles







Comments (0)
Click the $ button, enter the symbol, and select to link a stock, ETF, or other ticker.