


Bitcoin (BTCUSD) Fluctuated Significantly on Sep 7: Key Variables Behind the Move



Bitcoin (BTCUSD) is down 1.04% at Sep 7 10:25(ET), now at $79049.28, with a 7-day up of 0.27%.
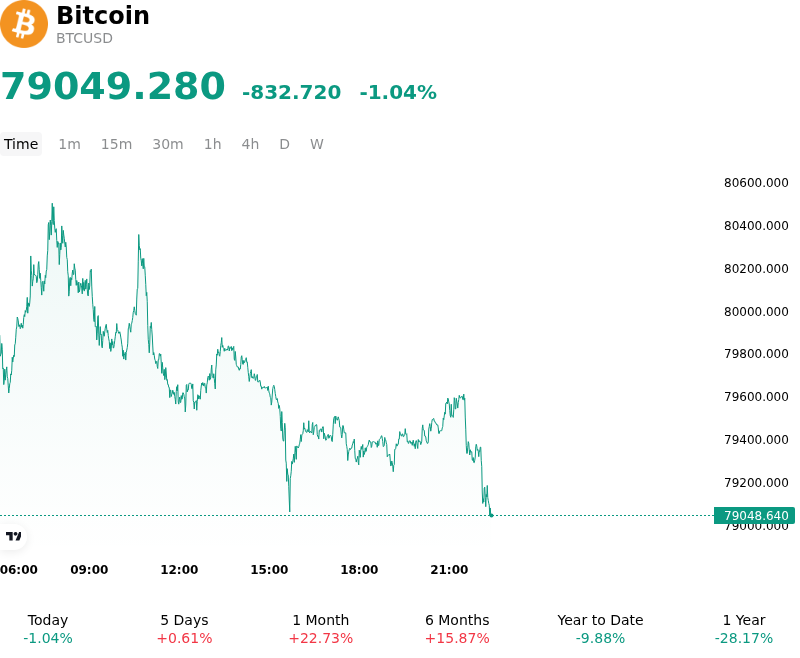
What is driving Bitcoin (BTCUSD)’s stock price down today?
Bitcoin experienced downward pressure primarily driven by shifting macro liquidity conditions and elevated U.S. interest rate expectations. Stronger-than-expected economic indicators, particularly robust U.S. labor market data, reignited market concerns regarding persistent monetary tightening ahead of the Federal Reserve policy meeting. The resulting upward movement in Treasury yields and a firming U.S. dollar reduced investor risk appetite for digital assets. With market participants awaiting key inflation reports, institutional investors selectively pared back risk exposure, leading to defensive positioning across global macro assets.
The pullback was further amplified by localized market liquidity dynamics and technical resistance. As Bitcoin encountered selling pressure near established overhead resistance levels, short-term momentum softened, triggering profit-taking. Lower trading volume across traditional market centers due to holiday-thinned trading sessions reduced order book depth, rendering price action more vulnerable to concentrated spot selling. In derivatives markets, a drop in total open interest signaled a healthy leverage unwind, as overextended long positions were flushed out without triggering systemic liquidations.
Despite short-term headwinds, underlying structural support from institutional participation remains resilient. Continued net capital inflows into spot Bitcoin ETFs demonstrated that long-term asset managers continue to utilize price weakness for strategic accumulation, offering a crucial liquidity buffer. Consequently, the current price movement reflects an event-driven macro repricing and short-term positioning reset rather than a structural deterioration. Market participants continue to monitor central bank guidance, upcoming inflation metrics, and institutional flow trends to assess the asset's broader trajectory.
Technical Analysis of Bitcoin (BTCUSD)
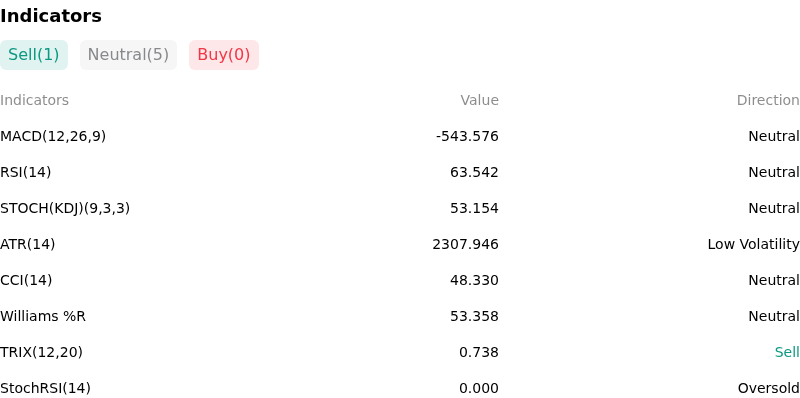
Technically, Bitcoin (BTCUSD) shows a MACD (12,26,9) value of -543.576, indicating a neutral signal. The RSI at 63.542 suggests neutral condition and the Williams %R at 53.358 suggests neutral condition. Please monitor closely.
More details about Bitcoin (BTCUSD)
Recent Events and Risks:
- Spot ETF Capital Outflows: Institutional demand has experienced sharp downside pressure, marked by over $236 million in net daily outflows from U.S. spot Bitcoin ETFs—led predominantly by heavy redemptions in BlackRock's IBIT—signaling institutional profit-taking and reduced spot buyer absorption.
- Macro Liquidity Squeeze and Hawkish Policy Signals: Hawkish Federal Reserve commentary alongside stronger-than-anticipated U.S. labor indicators has reduced expectations for near-term monetary easing, driving up bond yields and tightening global fiat liquidity at the expense of non-yielding digital assets.
- Derivative Long Liquidations and Leverage Overextension: Heavy long-skewed positioning in futures contracts near the $80,000–$82,000 overhead resistance zone triggered rapid liquidation events exceeding $200 million in long positions, leaving order books vulnerable to further forced selling if lower support zones give way.
- On-Chain Demand Contraction and Rising Exchange Reserves: On-chain metrics reveal that 30-day apparent Bitcoin demand has slid deep into negative territory (-80,000 BTC) while central exchange balances reached multi-month highs, increasing immediate overhead liquid supply against weakening spot buying interest.
This article may include AI-generated content that is human-reviewed, which is for reference and general information purposes only and does not constitute investment advice.
Recommended Articles








Comments (0)
Click the $ button, enter the symbol, and select to link a stock, ETF, or other ticker.