


Solana (SOLUSD) Is down 1.03% on Sep 7: Key Drivers to Watch



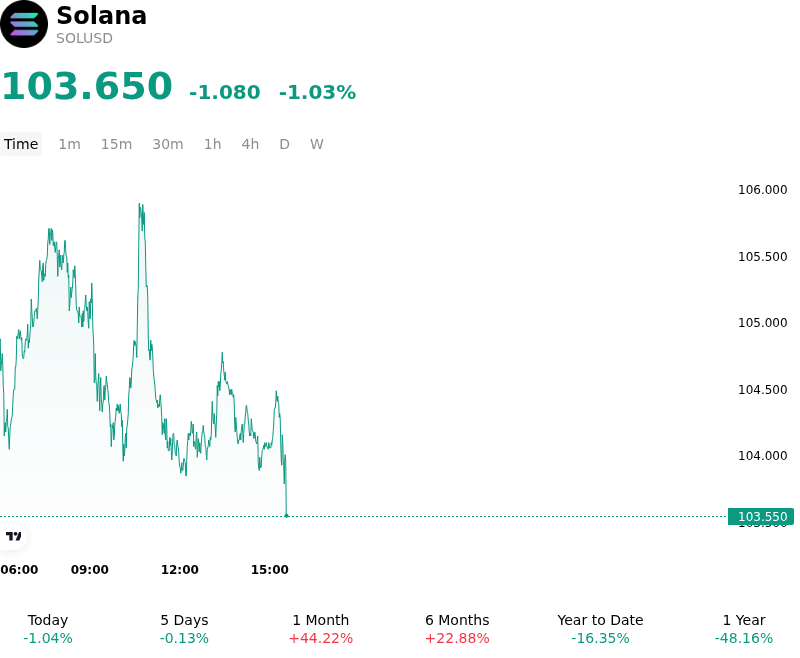
Solana (SOLUSD) is down 1.03% at Sep 7 03:35(ET), now at $103.65, with a 7-day up of 0.88%.
What is driving Solana (SOLUSD)’s stock price down today?
Solana experienced intraday downside pressure as broader digital asset markets faced macro-driven headwinds and short-term profit-taking at critical technical resistance. Following a multi-week advance that brought price action toward overhead technical barriers in the 106 to 108 dollar resistance zone, institutional and tactical traders reduced exposure to lock in recent gains. Macroeconomic sentiment was weighed down by firming U.S. Treasury yields and a resilient U.S. dollar, following robust economic data releases that reinforced expectations of a cautious Federal Reserve monetary policy stance.
In derivatives and spot venues, momentum indicators signaled short-term exhaustion as relative strength readings hovered near overbought territory. A modest contraction in open interest and a recalibration of funding rates reflected long position unwinding as leverage was reduced across altcoin derivative markets. Although intraday liquidity comfortably absorbed the selling volume above psychological support around the 100 dollar threshold, the temporary pause in spot buying enabled short-term profit-taking to dictate price action throughout the trading session.
Despite the temporary retracement, structural drivers and underlying network activity across the Solana ecosystem remain supportive. On-chain metrics continue to show strong operational health, supported by sustained decentralized exchange volumes, growing real-world asset tokenization, and high network fee generation. Additionally, institutional interest remains evidenced by ongoing positive net inflows into spot Solana investment vehicles over extended timeframes. Consequently, today's price weakness reflects routine technical consolidation and macro liquidity repricing rather than a broader deterioration in structural fundamentals.
Technical Analysis of Solana (SOLUSD)
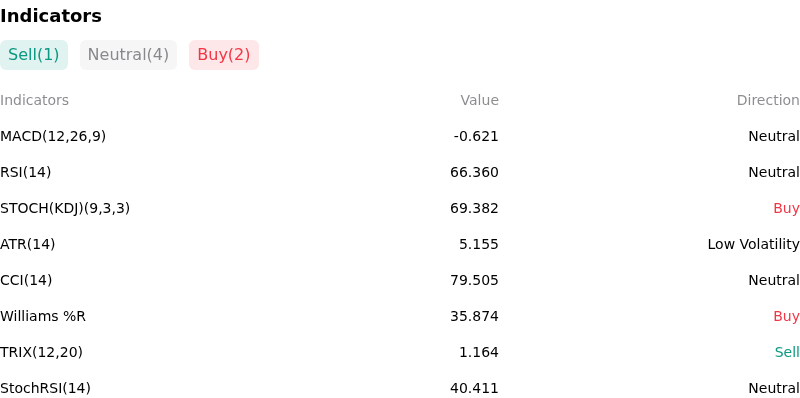
Technically, Solana (SOLUSD) shows a MACD (12,26,9) value of -0.621, indicating a neutral signal. The RSI at 66.360 suggests neutral condition and the Williams %R at 35.874 suggests buy condition. Please monitor closely.
More details about Solana (SOLUSD)
Recent Events and Risks:
- Deceleration in ETF Inflows and Daily Outflows: Institutional demand for U.S. spot Solana exchange-traded products dropped sharply, with weekly net inflows plunging by nearly 97%, accompanied by single-day net outflows of $5.2 million, dampening baseline spot accumulation for the token.
- Elevated Derivatives Liquidation Risk near Support: Recent market pullbacks triggered nearly $30 million in SOL long liquidations, leaving derivative market leverage fragile and exposing the asset to cascading margin calls if price breaks below the $100 psychological level toward the $93.75 support region.
- Failed Fee-Burn Governance Proposal: Solana validators rejected a governance measure that would have introduced usage-based fees, failing to implement a mechanism expected to burn roughly 9,000 SOL daily and removing an anticipated supply-reduction catalyst.
- Macro Risk-Off Sentiment and Yield Pressures: A broader macro shift driven by elevated U.S. Treasury yields and higher energy prices has triggered risk aversion across global markets, reducing investor appetite for high-beta digital assets and dampening altcoin liquidity.
This article may include AI-generated content that is human-reviewed, which is for reference and general information purposes only and does not constitute investment advice.
Recommended Articles










Comments (0)
Click the $ button, enter the symbol, and select to link a stock, ETF, or other ticker.