


XRP (XRPUSD) Suddenly Goes down 1.03% on Sep 6: What's Driving This



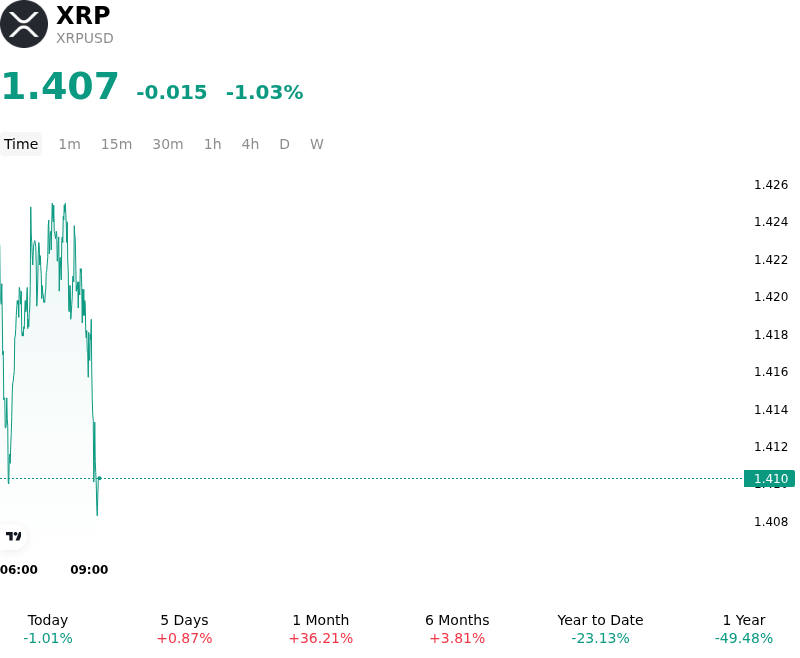
XRP (XRPUSD) is down 1.03% at Sep 6 21:20(ET), now at $1.4073, with a 7-day up of 1.49%.
What is driving XRP (XRPUSD)’s stock price down today?
The intraday retracement in XRP reflects short-term profit-taking and structural overhead resistance following an aggressive late-August price expansion. After testing multi-week high resistance zones, spot market momentum moderated as traders chose to lock in gains near key breakeven levels established during the previous month's rally. This cooling-off phase was further amplified by a temporary lull in institutional creation activity across U.S. spot XRP exchange-traded funds, where net daily inflows paused following a sustained period of heavy primary-market accumulation.
Macroeconomic and regulatory positioning continue to dictate broader risk appetite across the digital asset space. Market participants are exercising heightened discipline ahead of critical upcoming policy catalysts, including key inflation releases, Federal Reserve interest rate guidance, and legislative proceedings surrounding the CLARITY Act in the U.S. Senate. While long-term institutional participation remains firmly backed by substantial cumulative ETF asset growth, near-term institutional capital deployment has slowed as traders evaluate whether high real yields and macroeconomic liquidity conditions will favor risk-on assets in the coming sessions.
Derivatives market data indicates a healthy liquidation of over-leveraged long positions rather than a fundamental structural breakdown. On-chain activity reflects localized caution, partially influenced by isolated security alerts within adjacent ecosystem wallet providers, though core XRP Ledger order-book liquidity and institutional transfer volumes remain stable. Institutional investors are closely monitoring whether spot ETF inflows reaccelerate alongside macro liquidity injections to establish a firm base above key moving averages.
Technical Analysis of XRP (XRPUSD)
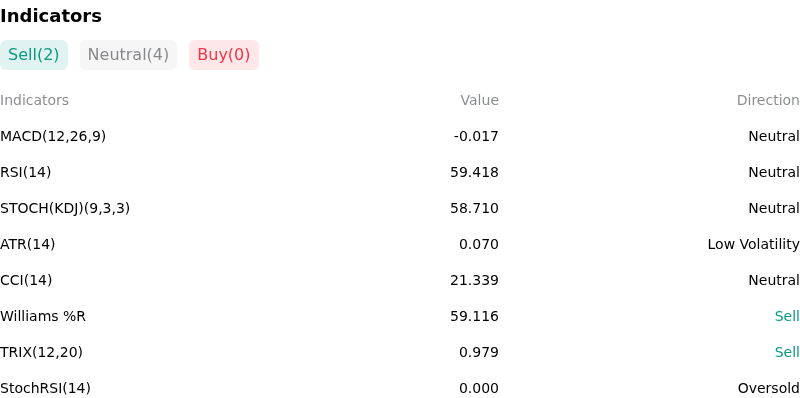
Technically, XRP (XRPUSD) shows a MACD (12,26,9) value of -0.017, indicating a neutral signal. The RSI at 59.418 suggests neutral condition and the Williams %R at 59.116 suggests sell condition. Please monitor closely.
More details about XRP (XRPUSD)
Recent Events and Risks:
- Macro Pressure and Derivatives Liquidations: Stronger-than-expected U.S. economic data and persistent monetary policy concerns triggered a risk-off wave across digital assets, driving over $14 million in forced long position liquidations in XRP futures and accelerating intraday price drops.
- Escrow Releases and Whale Wallet Inflows: Scheduled periodic XRP escrow unlocks alongside elevated whale token transfers to centralized exchange wallets have heightened spot market supply, increasing overhead sell pressure.
- Regulatory and Legislative Overhang: Upcoming votes on key U.S. digital asset legislation and advancing SEC market infrastructure proposals continue to generate headline uncertainty, prompting institutional traders to reduce leveraged exposure.
- Key Technical Support Fragility: XRP's tight consolidation near the critical $1.40 support level leaves the market vulnerable to cascade risk, where a decisive technical breakdown threatens to trigger secondary stop-loss orders and further leverage unwinding.
This article may include AI-generated content that is human-reviewed, which is for reference and general information purposes only and does not constitute investment advice.
Recommended Articles








Comments (0)
Click the $ button, enter the symbol, and select to link a stock, ETF, or other ticker.