


Solana (SOLUSD) Is up 1.00% on Sep 5: What Are the Risk Factors?



Solana (SOLUSD) is up 1.00% at Sep 5 05:05(ET), now at $101.77, with a 7-day down of 2.36%.
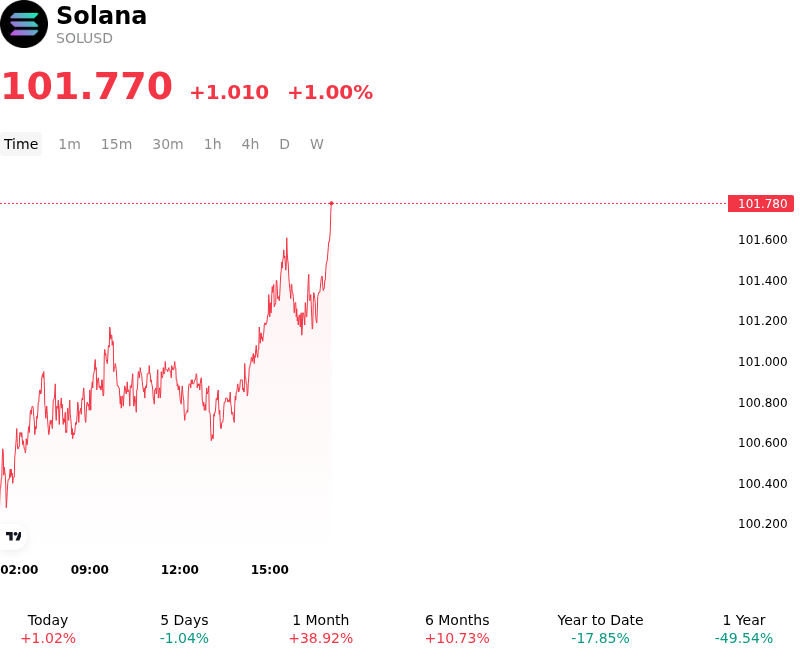
What is driving Solana (SOLUSD)’s stock price up today?
The upward movement in Solana reflects a combination of regulatory clarity, improving macroeconomic risk sentiment, and steady institutional participation. Investor sentiment across primary smart contract platforms was buoyed by regulatory developments, notably SEC listing order approvals clarifying Solana's status as a digital commodity within institutional product frameworks. This regulatory progress helped reduce long-standing compliance uncertainty, allowing institutional asset managers to expand multi-asset allocations and structured product offerings. Simultaneously, dovish macroeconomic commentary from Federal Reserve officials regarding disinflationary trends bolstered broader risk appetite, stabilizing financial market conditions and channeling capital back into leading Layer-1 assets.
Institutional capital flows served as a key driver of price resilience. Cumulative net inflows into U.S. spot Solana exchange-traded funds remained robust, surpassing $1.3 billion as institutional allocators continued leveraging regulated wrappers to access native staking yield and ecosystem exposure. This structural demand has been reinforced by expanded distribution across major traditional wealth management platforms, broadening access for institutional and retail accounts alike. The ongoing accumulation through exchange-traded products has helped absorb spot liquidity, creating a higher demand floor during market consolidations.
Fundamental network metrics and on-chain capital activity provided additional tailwinds. Solana maintained its leadership position in decentralized exchange volume, supported by high transaction velocity, stablecoin liquidity, and expanding real-world asset tokenization initiatives. The platform continues to capture market share in tokenized equities and debt instruments due to its low latency and cost-effective execution. Furthermore, protocol upgrades expanding transaction payload sizes and advancing scaling infrastructure reassured market participants regarding Solana's long-term enterprise utility and capacity.
From a market positioning standpoint, derivatives activity supported the advance as short liquidations across altcoin trading pairs created incremental buy pressure. The successful defense of key technical support levels encouraged momentum-driven accounts to re-enter long positions. Although traders continue to monitor broader macroeconomic data and interest rate expectations ahead of upcoming monetary policy meetings, the combination of regulatory tailwinds, institutional access expansion, and strong application-layer usage supports a constructive outlook for the asset.
Technical Analysis of Solana (SOLUSD)
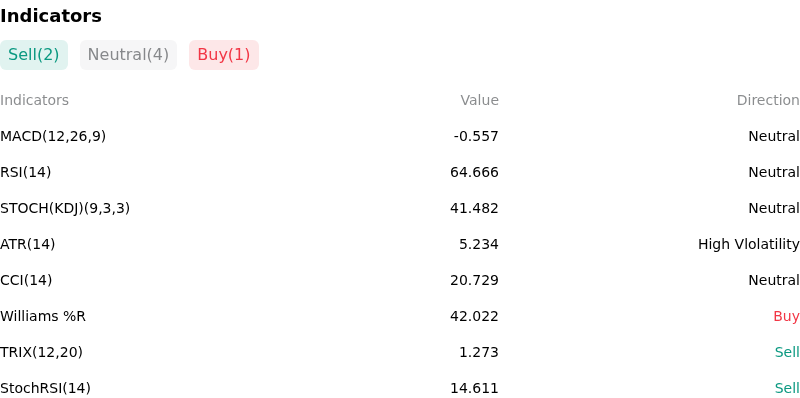
Technically, Solana (SOLUSD) shows a MACD (12,26,9) value of -0.557, indicating a neutral signal. The RSI at 64.666 suggests neutral condition and the Williams %R at 42.022 suggests buy condition. Please monitor closely.
More details about Solana (SOLUSD)
Recent Events and Risks:
- Derivatives Liquidation and Negative Funding Rates: Recent broad market liquidation waves accompanied by Solana futures funding rates slipping into negative territory indicate growing bearish sentiment in derivatives markets, leaving remaining open interest susceptible to liquidation cascades during intraday drawdowns.
- DeFi Ecosystem Activity and TVL Contraction: Total Value Locked (TVL) on Solana remains significantly below previous cycle highs, with trading platforms like PumpSwap and HumidiFi experiencing steep short-term fee and volume drops, signaling a reduction in speculative transaction velocity.
- Technical Momentum Stall and Downside Risk Targets: Price action has stalled below resistance in the $105–$110 range as daily MACD momentum indicators weaken, leading prediction markets to price elevated odds of a drop below $100 toward secondary support around $94.40.
- Regulatory Overhaul and Smart Contract Scrutiny: Ongoing U.S. SEC initiatives to overhaul transfer agent rules for blockchain-based and tokenized real-world assets maintain regulatory pressure on high-throughput smart contract platforms and decentralized exchanges.
This article may include AI-generated content that is human-reviewed, which is for reference and general information purposes only and does not constitute investment advice.
Recommended Articles








Comments (0)
Click the $ button, enter the symbol, and select to link a stock, ETF, or other ticker.