


AST SpaceMobile Inc Stock (ASTS) Moved Up by 10.66% on Sep 2: Key Drivers Unveiled



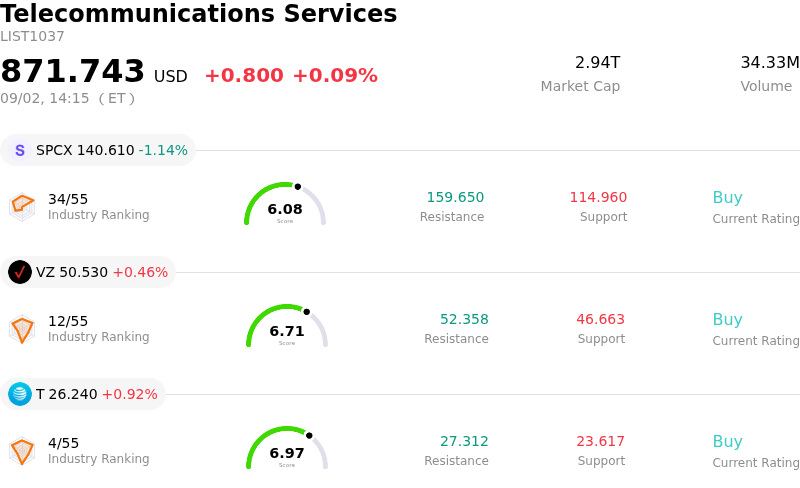
AST SpaceMobile Inc (ASTS) moved up by 10.66%. The Telecommunications Services sector is up by 0.09%. The company outperformed the industry. Top 3 stocks by turnover in the sector: SpaceX (SPCX) down 1.14%; Verizon Communications Inc (VZ) up 0.46%; AT&T Inc (T) up 0.92%.
What is driving AST SpaceMobile Inc (ASTS)’s stock price up today?
AST SpaceMobile experienced a strong upward rally and heightened intraday volatility, largely driven by a bullish regulatory disclosure and renewed market confidence following a recent consolidation phase. An SEC Form 4 filing revealed open-market insider share purchases by Director Adriana Cisneros, signaling executive conviction following the stock's recent pullback. In high-growth, capital-intensive space satellite ventures, insider buying often acts as a powerful sentiment anchor, reassuring retail and institutional market participants of long-term fundamentals.
The positive momentum was further amplified by favorable sell-side coverage and target price adjustments from research institutions. A fresh coverage initiation with a Buy rating from Berenberg, alongside elevated price targets from firms such as Cantor Fitzgerald, highlighted the company's unique market position in space-based direct-to-cell cellular broadband infrastructure. Institutional analysts underscored that despite near-term capital expenditure requirements and historical cash burn, the company's expanding satellite constellation offers a hard-to-replicate technological moat capable of generating recurring service revenue as commercialization ramps up.
Fundamental operational developments continue to support the underlying bullish thesis. The successful deployment of next-generation BlueBird satellites, alongside ongoing integration testing with international mobile network operators and planned commercial direct-to-cell rollouts with major carrier partners, reinforces execution visibility. With management reaffirming its annual revenue guidance, the confluence of insider buying, analyst endorsement, and operational scaling catalyzed strong demand across institutional and retail investor bases.
Technical Analysis of AST SpaceMobile Inc (ASTS)
Technically, AST SpaceMobile Inc (ASTS) shows a MACD (12,26,9) value of -1.310, indicating a sell signal. The RSI at 46.461 suggests neutral condition and the Williams %R at 67.484 suggests sell condition. Please monitor closely.
Fundamental Analysis of AST SpaceMobile Inc (ASTS)
AST SpaceMobile Inc (ASTS) is in the Telecommunications Services industry. Its latest annual revenue is $70.92M, ranking 61 in the industry. The net profit is $-341.94M, ranking 53 in the industry. Company Profile
Over the past month, multiple analysts have rated the company as Hold, with an average price target of $81.34, a high of $115.00, and a low of $42.50.
More details about AST SpaceMobile Inc (ASTS)
Company Specific Risks:
- Satellite Manufacturing and Launch Cadence Delays: Analysts have flagged potential production bottlenecks for BlueBird 15 and 16 satellites, threatening management's ambitious target to deploy 45 satellites in orbit to enable continuous service by early 2027.
- Widening Financial Losses and Heavy Cash Burn: Second-quarter results revealed net losses expanding to $230.9 million ($0.77 per share), missing consensus expectations as capital expenditures for constellation deployment continue to outpace commercial revenue growth.
- Dilution Overhang from Massive Debt Financings: Consecutive billion-dollar convertible senior note offerings have pushed total corporate debt to approximately $4 billion, creating persistent long-term dilution risk for existing equity holders.
- Execution Lag in Converting Backlog to Cash Flow: Despite citing over $1.3 billion in contracted operator relationships, the fundamental conversion of non-binding commercial agreements into recurring cash flows remains slow, leaving profitability a distant milestone.
This article may include AI-generated content that is human-reviewed, which is for reference and general information purposes only and does not constitute investment advice.
Recommended Articles








Comments (0)
Click the $ button, enter the symbol, and select to link a stock, ETF, or other ticker.