


Johnson & Johnson Stock (JNJ) Opened Up by 3.15% on Sep 2: Key Drivers Unveiled



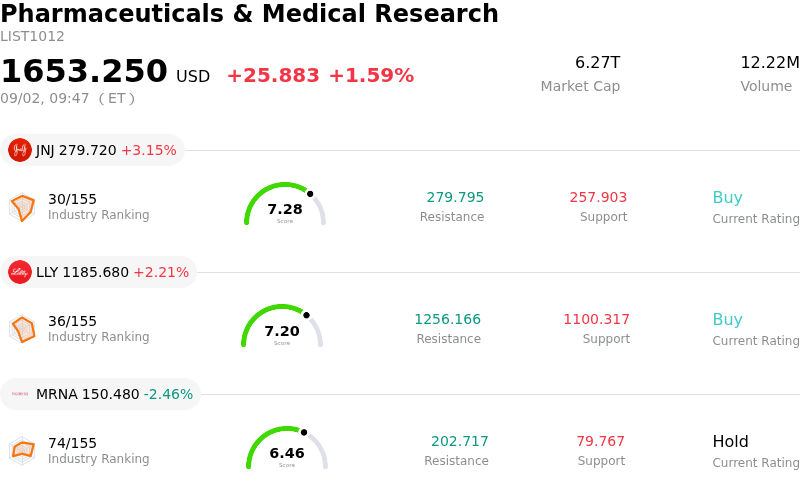
Johnson & Johnson (JNJ) opened up by 3.15%. The Pharmaceuticals & Medical Research sector is up by 1.59%. The company outperformed the industry. Top 3 stocks by turnover in the sector: Johnson & Johnson (JNJ) up 3.15%; Eli Lilly and Co (LLY) up 2.21%; Moderna Inc (MRNA) down 2.46%.
What is driving Johnson & Johnson (JNJ)’s stock price up today?
Shares of Johnson & Johnson moved higher amid significant intraday trading activity, primarily supported by defensive sector rotation across equity markets. As broader market indices experienced volatility and downside pressure, institutional investors pivoted toward large-cap, high-quality healthcare equities with durable earnings profiles, strong balance sheets, and steady dividend yields. Johnson & Johnson acted as a prime beneficiary of this capital shift, attracting risk-averse inflows looking for stability and cash flow visibility in an uncertain macroeconomic environment.
Underlying market sentiment around the stock has also been buoyed by ongoing progress regarding its historical legal liabilities. Broad market participants continue to view the advancement of the proposed global talc litigation settlement as a significant de-risking catalyst that helps clear a long-standing valuation discount. Clearing this legal overhang, coupled with recent regulatory milestones across its Innovative Medicine pipeline—including FDA clearance for new therapeutic treatments like IMAAVY and expanding European approvals for TECVAYLI—has bolstered investor confidence in the company's long-term commercial growth strategy.
From a valuation perspective, discounted cash flow metrics and strong operating cash flows continue to signal long-term intrinsic upside. Following solid quarterly earnings results that featured top-and-bottom-line beats alongside raised full-year operational guidance, institutional accumulation has provided a firm floor for the equity. Although intraday price swings reflected ongoing broader market reallocations, the overall upward trajectory demonstrates sustained investor demand for resilient mega-cap healthcare franchises.
Technical Analysis of Johnson & Johnson (JNJ)
Technically, Johnson & Johnson (JNJ) shows a MACD (12,26,9) value of 0.639, indicating a buy signal. The RSI at 65.449 suggests neutral condition and the Williams %R at 12.450 suggests overbought condition. Please monitor closely.
Media Coverage of Johnson & Johnson (JNJ)
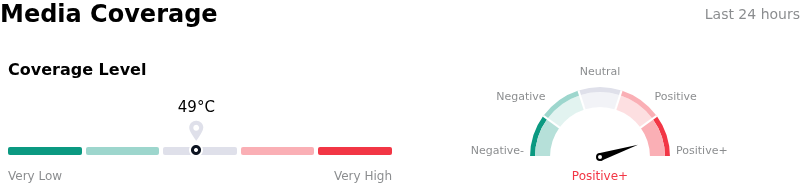
In terms of media coverage, Johnson & Johnson (JNJ) shows a coverage score of 49, indicating a moderate level of media attention. The overall market sentiment index is currently in extremely bullish zone.
Fundamental Analysis of Johnson & Johnson (JNJ)
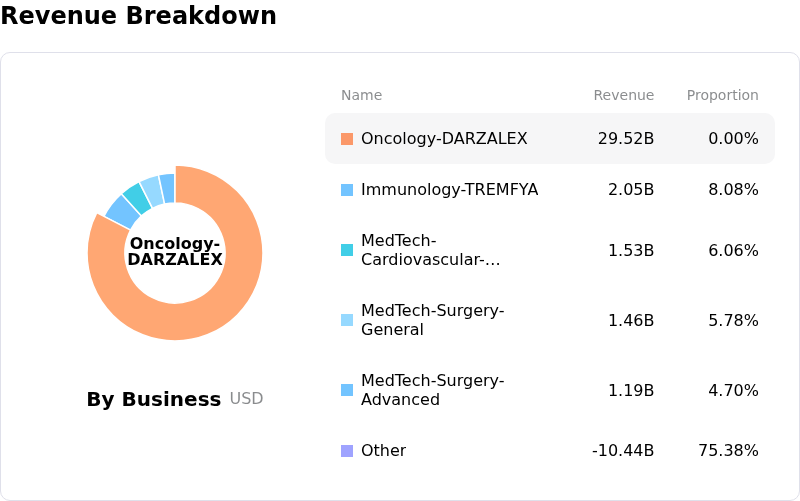
Johnson & Johnson (JNJ) is in the Pharmaceuticals & Medical Research industry. Its latest annual revenue is $94.19B, ranking 3 in the industry. The net profit is $26.80B, ranking 1 in the industry. Company Profile
Over the past month, multiple analysts have rated the company as Buy, with an average price target of $270.38, a high of $305.00, and a low of $170.00.
More details about Johnson & Johnson (JNJ)
Company Specific Risks:
- Stelara Exclusivity Loss and Top-Line Revenue Erosion: The loss of patent exclusivity for blockbuster immunology drug Stelara continues to inflict significant sales declines, dropping over 50% year-over-year and requiring newer oncology and immunology assets to continuously deliver above-average growth just to offset top-line revenue drag.
- MedTech Growth Softness and Pre-Tax Margin Compression: Institutional analysts highlight ongoing growth deceleration in the MedTech division alongside management's 75 basis point reduction in full-year adjusted pre-tax margin guidance following recent pipeline acquisitions, raising concerns over segment operational leverage.
- Talc Litigation Settlement Contingency Risks: While Johnson & Johnson proposed a $5.5 billion resolution for tens of thousands of talc-related ovarian cancer claims, the deal remains strictly contingent on reaching a 95% participation threshold among plaintiff law firms, keeping legal overhang and potential cash flow liabilities active if threshold requirements are missed.
- Insider Share Offloading by Executive Leadership: Regulatory SEC Form 4 filings reveal substantial insider option exercises and immediate open-market share liquidations by top executives—including CEO Joaquin Duato selling over 123,000 shares—signaling potential valuation ceilings following the stock's multi-month rally.
This article may include AI-generated content that is human-reviewed, which is for reference and general information purposes only and does not constitute investment advice.
Recommended Articles








Comments (0)
Click the $ button, enter the symbol, and select to link a stock, ETF, or other ticker.