


Interactive Brokers Group Inc Stock (IBKR) Moved Down by 5.06% on Sep 1: Facts Behind the Movement



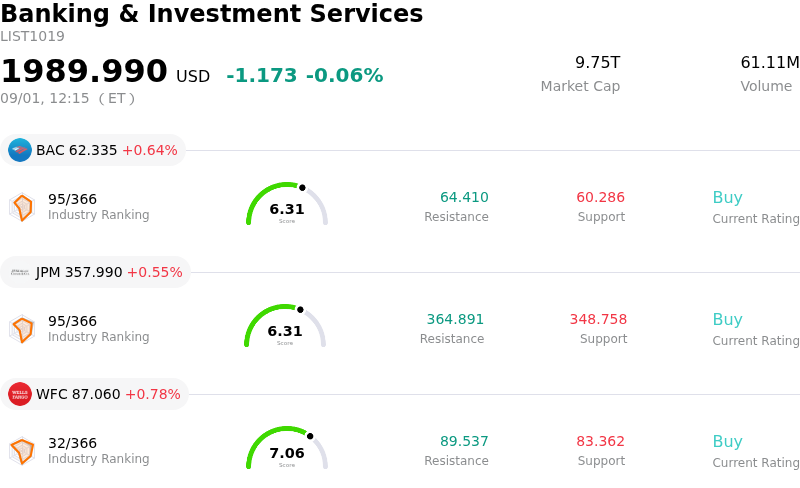
Interactive Brokers Group Inc (IBKR) moved down by 5.06%. The Banking & Investment Services sector is down by 0.06%. The company underperformed the industry. Top 3 stocks by turnover in the sector: Bank of America Corp (BAC) up 0.64%; JPMorgan Chase & Co (JPM) up 0.55%; Wells Fargo & Co (WFC) up 0.76%.
What is driving Interactive Brokers Group Inc (IBKR)’s stock price down today?
Interactive Brokers experienced notable downward pressure as market sentiment shifted following a cautious initiation of coverage by Wall Street research. UBS assigned a Neutral rating to the platform, highlighting that while the brokerage remains a best-in-class operator with industry-leading efficiency and solid long-term growth potential, its stock price already discounts much of this upside. Analyst commentary emphasized that the equity trades at a premium multiple relative to historic averages and broader peer valuations, leaving near-term gains heavily reliant on exceeding increasingly demanding financial targets.
The pullback coincided with the company's release of its latest monthly brokerage metrics and its ex-dividend date, encouraging short-term profit-taking after a substantial multi-month rally. Following strong year-to-date gains driven by robust trading activity and steady international client acquisition, investors used the combination of the ex-dividend adjustment and elevated valuation debate as an opportunity to lock in gains. Heightened options activity and technical selling pressure further amplified intraday volatility, pushing the stock below its short-term moving averages.
From an institutional research perspective, the decline represents a recalibration of sentiment rather than a fundamental breakdown in operational performance. Interactive Brokers continues to generate exceptional pretax margins and robust cash flows, supported by high customer engagement, expanding international infrastructure partnerships, and product line enhancements. However, in an environment of shifting monetary policy expectations and competitive broker repricing, institutional capital appears focused on valuation discipline. Future stock performance will depend on the company's ability to maintain account growth momentum, expand fee-generating product adoption, and navigate potential net interest margin sensitivity.
Technical Analysis of Interactive Brokers Group Inc (IBKR)
Technically, Interactive Brokers Group Inc (IBKR) shows a MACD (12,26,9) value of 0.594, indicating a buy signal. The RSI at 49.002 suggests neutral condition and the Williams %R at 65.330 suggests sell condition. Please monitor closely.
Media Coverage of Interactive Brokers Group Inc (IBKR)
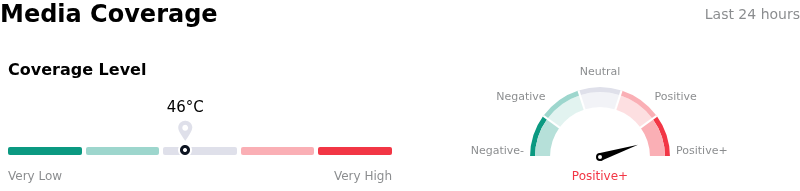
In terms of media coverage, Interactive Brokers Group Inc (IBKR) shows a coverage score of 46, indicating a moderate level of media attention. The overall market sentiment index is currently in extremely bullish zone.
Fundamental Analysis of Interactive Brokers Group Inc (IBKR)
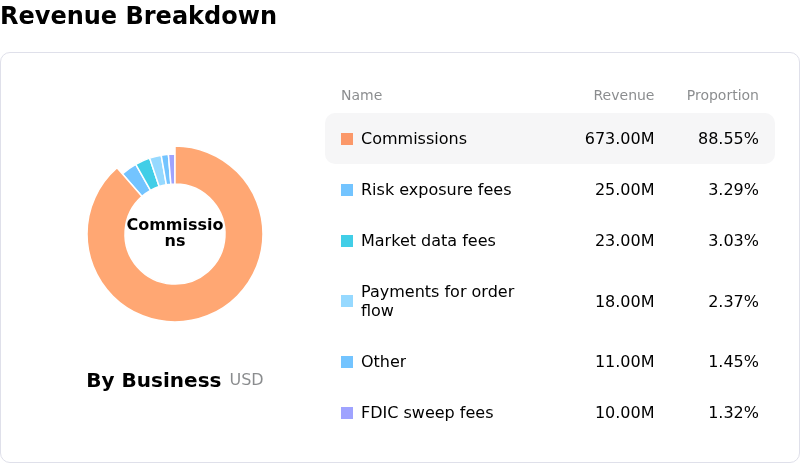
Interactive Brokers Group Inc (IBKR) is in the Banking & Investment Services industry. Its latest annual revenue is $10.00B, ranking 24 in the industry. The net profit is $984.00M, ranking 24 in the industry. Company Profile
Over the past month, multiple analysts have rated the company as Buy, with an average price target of $106.31, a high of $121.00, and a low of $72.18.
More details about Interactive Brokers Group Inc (IBKR)
Company Specific Risks:
- Wall Street Analyst Downgrades and Premium Valuation Concerns: UBS downgraded Interactive Brokers from Buy to Neutral on September 1, 2026, following analyst warnings from Raymond James regarding elevated valuation multiples near 30x–36x forward earnings that leave the equity vulnerable to decelerated account additions and broader market pullbacks.
- Sequential Deceleration in Monthly Trading Metrics: In its August 2026 brokerage metrics reported on September 1, 2026, Daily Average Revenue Trades (DARTs) declined 3% month-over-month to 4.276 million, while annualized average cleared DARTs per client account contracted to 168 from 180 in July, highlighting a sequential slowdown in underlying client trading velocity.
- Equity Overhang and Share Dilution Risk: Regulatory filings detailing shelf registration takedowns under Form S-3 and Form 8-K for over 2.49 million Class A common shares alongside additional promotional equity awards create potential market overhang and immediate equity dilution risks for existing shareholders.
This article may include AI-generated content that is human-reviewed, which is for reference and general information purposes only and does not constitute investment advice.
Recommended Articles








Comments (0)
Click the $ button, enter the symbol, and select to link a stock, ETF, or other ticker.