


Tesla Inc Stock (TSLA) Opened Down by 3.30% on Sep 1: What Signal Does It Send?



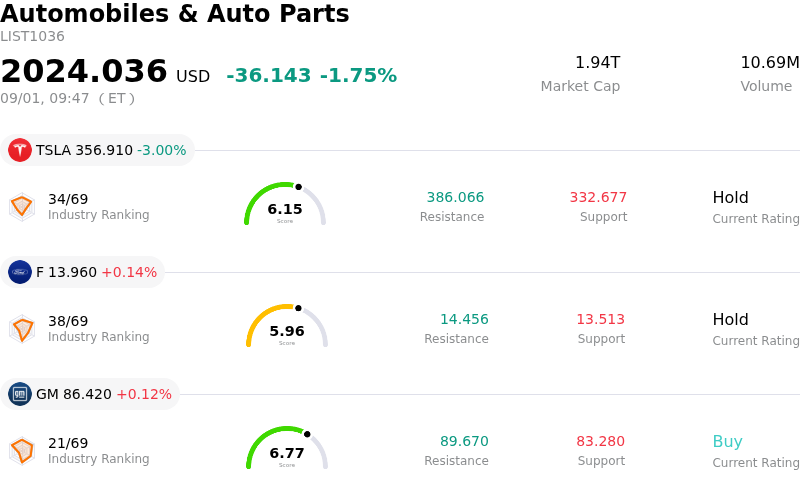
Tesla Inc (TSLA) opened down by 3.30%. The Automobiles & Auto Parts sector is down by 1.75%. The company underperformed the industry. Top 3 stocks by turnover in the sector: Tesla Inc (TSLA) down 3.30%; Ford Motor Co (F) up 0.14%; General Motors Co (GM) up 0.12%.
What is driving Tesla Inc (TSLA)’s stock price down today?
Tesla experienced downward price movement as profit-taking and technical digestion took hold following a significant rally throughout August. Having surged over the past month on strong delivery updates and optimism surrounding autonomous driving initiatives, the stock hit overbought momentum indicators on shorter timeframes. As shares approached long-term technical resistance levels, short-term traders and systematic funds triggered profit-taking, digesting recent gains ahead of key operational milestones.
A major driver of the intraday volatility is institutional de-risking ahead of the upcoming Cybercab launch event scheduled for early September. While anticipation for Tesla’s autonomous fleet rollout and Full Self-Driving capabilities has fueled bullish positioning, market participants are increasingly treating the event as a binary catalyst. Uncertainty regarding commercialization timelines, regulatory approvals across key jurisdictions, and near-term revenue generation from physical AI assets has prompted some institutional investors to trim exposure and hedge upside sensitivity prior to the official event.
Fundamental valuation pressures and operational expenses also contributed to the cautious sentiment. With valuation multiples remaining stretched relative to broader automotive peers, elevated capital expenditure projections for AI infrastructure and humanoid robotics continue to weigh on medium-term margin expectations. Furthermore, mixed vehicle registration trends across major European territories highlighted ongoing regional demand fluctuations. While long-term catalysts in energy storage and commercial heavy trucking remain intact, near-term caution dominated trading as the market awaits concrete execution metrics.
Technical Analysis of Tesla Inc (TSLA)
Technically, Tesla Inc (TSLA) shows a MACD (12,26,9) value of 7.321, indicating a neutral signal. The RSI at 52.611 suggests neutral condition and the Williams %R at 31.914 suggests buy condition. Please monitor closely.
Media Coverage of Tesla Inc (TSLA)
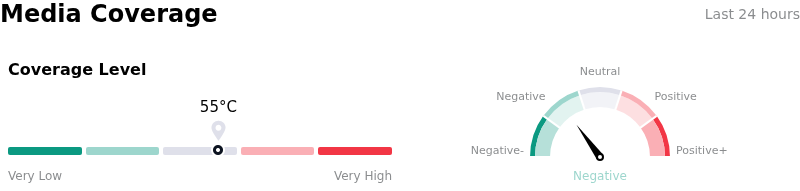
In terms of media coverage, Tesla Inc (TSLA) shows a coverage score of 55, indicating a moderate level of media attention. The overall market sentiment index is currently in bearish zone.
Fundamental Analysis of Tesla Inc (TSLA)
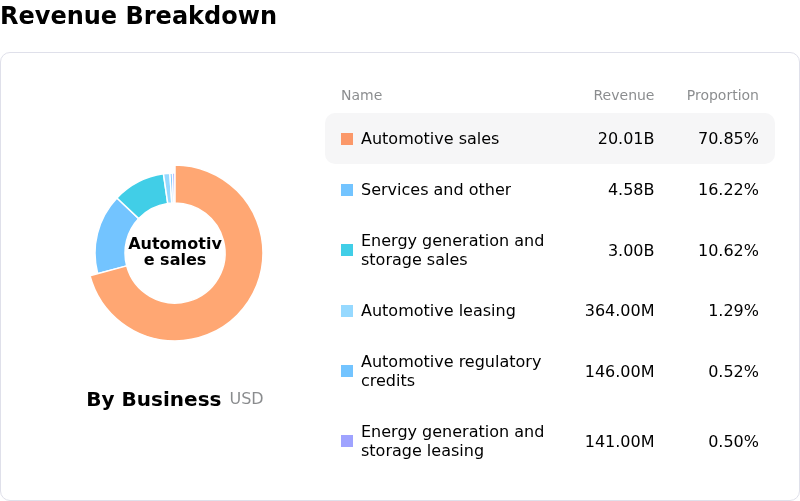
Tesla Inc (TSLA) is in the Automobiles & Auto Parts industry. Its latest annual revenue is $94.83B, ranking 6 in the industry. The net profit is $3.79B, ranking 2 in the industry. Company Profile
Over the past month, multiple analysts have rated the company as Hold, with an average price target of $381.42, a high of $600.00, and a low of $24.86.
More details about Tesla Inc (TSLA)
Company Specific Risks:
- Cybercab Launch Event Risk and Valuation Disconnect: Increased short-term volatility and profit-taking ahead of the Cybercab autonomy event reflect analyst concerns that over 30% of Tesla's valuation hinges on robotaxi monetization, despite the segment currently contributing less than 0.5% of total revenue.
- Escalating Capital Expenditures and Margin Compression: An expanded 2026 capital budget of $25 billion dedicated to scaling Optimus humanoid robots and AI infrastructure threatens to further depress free cash flow following recent quarterly earnings where automotive margins contracted to 16.8% and EPS missed consensus estimates ($0.33 vs. $0.50 expected).
- Regional Delivery Contraction Across Key European Markets: August registration data across Europe highlighted severe regional sales drops, including a 79% year-over-year collapse in Norway and a 41% fall in Sweden, exposing ongoing underlying demand weakness and competitive pressure in core EV regions.
- Extreme Valuation Multiples and Institutional Sell Ratings: A elevated trailing price-to-earnings ratio above 340x leaves the stock highly vulnerable to sharp pullbacks if growth in non-automotive initiatives stalls, backed by reiterated Wall Street sell ratings highlighting the disconnect between the stock's valuation and weakening underlying EV fundamentals.
This article may include AI-generated content that is human-reviewed, which is for reference and general information purposes only and does not constitute investment advice.
Recommended Articles








Comments (0)
Click the $ button, enter the symbol, and select to link a stock, ETF, or other ticker.