


Ciena Corp Stock (CIEN) Closed Down by 5.35% on Aug 28: What Investors Need To Know



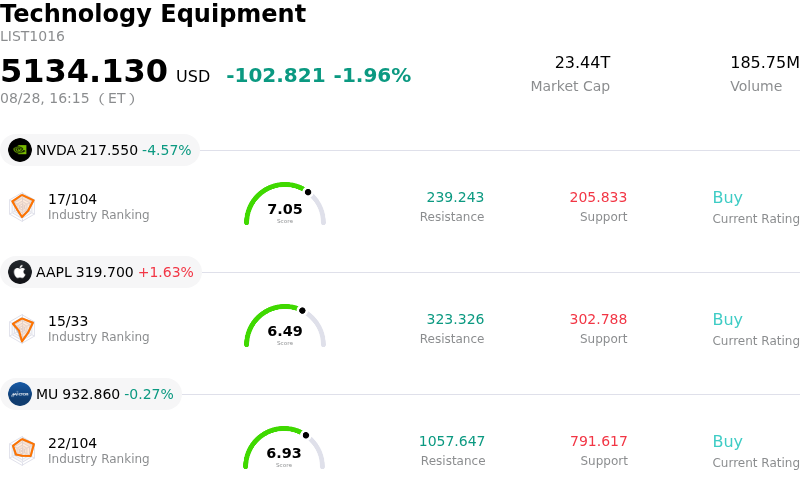
Ciena Corp (CIEN) closed down by 5.35%. The Technology Equipment sector is down by 1.96%. The company underperformed the industry. Top 3 stocks by turnover in the sector: NVIDIA Corp (NVDA) down 4.57%; Apple Inc (AAPL) up 1.63%; Micron Technology Inc (MU) down 0.27%.
What is driving Ciena Corp (CIEN)’s stock price down today?
Ciena Corporation experienced downward price movement as investors engaged in profit-taking and strategic portfolio adjustments ahead of the company's upcoming fiscal third-quarter earnings release. After benefiting from a substantial multi-month rally fueled by artificial intelligence infrastructure investments and expanding optical networking demand, the stock encountered selling pressure driven by heightened valuation sensitivity and elevated earnings expectations.
A primary catalyst for the market's cautious stance is ongoing supply chain friction within critical hardware categories. Although enterprise demand, cloud hyperscaler spending, and overall order backlogs remain robust, persistent supply constraints involving key optical components—such as specialized modems and pump lasers—continue to restrict maximum delivery capacity. Market participants are increasingly evaluating execution risk, concerned that these component shortages could constrain near-term revenue realization despite strong underlying business momentum.
Additionally, recent analyst updates have contributed to near-term caution. While major brokerage firms generally maintain positive long-term outlooks on the optical equipment provider, selective price target trims from key Wall Street analysts have highlighted the limited margin for error at current valuation multiples. The combination of pre-earnings position trimming, supply-side execution concerns, and elevated market expectations resulted in heightened volatility and increased selling pressure during the session.
Technical Analysis of Ciena Corp (CIEN)
Technically, Ciena Corp (CIEN) shows a MACD (12,26,9) value of -1.975, indicating a sell signal. The RSI at 43.776 suggests neutral condition and the Williams %R at 84.073 suggests oversold condition. Please monitor closely.
Media Coverage of Ciena Corp (CIEN)
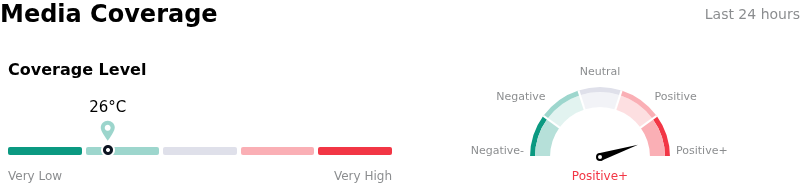
In terms of media coverage, Ciena Corp (CIEN) shows a coverage score of 26, indicating a low level of media attention. The overall market sentiment index is currently in extremely bullish zone.
Fundamental Analysis of Ciena Corp (CIEN)
Ciena Corp (CIEN) is in the Technology Equipment industry. Its latest annual revenue is $4.77B, ranking 9 in the industry. The net profit is $123.34M, ranking 14 in the industry. Company Profile
Over the past month, multiple analysts have rated the company as Buy, with an average price target of $578.59, a high of $720.00, and a low of $490.00.
More details about Ciena Corp (CIEN)
Company Specific Risks:
- Component Supply Shortages and Backlog Conversion Risk: Wall Street analyst notes highlight ongoing supply chain bottlenecks in optical networking hardware, specifically regarding modem and pump-laser components, which jeopardize Ciena's ability to convert its sizable order backlog into timely revenue recognition.
- Analyst Price Target Cuts and Valuation Overhang: Recent price target reductions from research firms and elevated valuation multiples—such as a Price-to-Book ratio of 19.57x—have amplified downside sensitivity, making the stock vulnerable to sharp profit-taking and sector-wide risk-off rotations.
- Executive Insider Dispositions and Convertible Notes Dilution: Recent SEC Form 4 filings detail persistent executive insider selling totaling over $90 million over the past 12 months, compounded by market concerns over potential share dilution from $2.875 billion in outstanding convertible senior notes.
- Historical Pre-Earnings Downside Volatility: Derivatives activity reflects an implied 9.4% price swing ahead of upcoming fiscal Q3 results, with historical data showing a pattern of sharp post-earnings selloffs whenever reported performance fails to significantly beat aggressive consensus estimates.
This article may include AI-generated content that is human-reviewed, which is for reference and general information purposes only and does not constitute investment advice.
Recommended Articles









Comments (0)
Click the $ button, enter the symbol, and select to link a stock, ETF, or other ticker.