


Newmont Corporation Stock (NEM) Moved Down by 3.48% on Aug 28: What Investors Need To Know



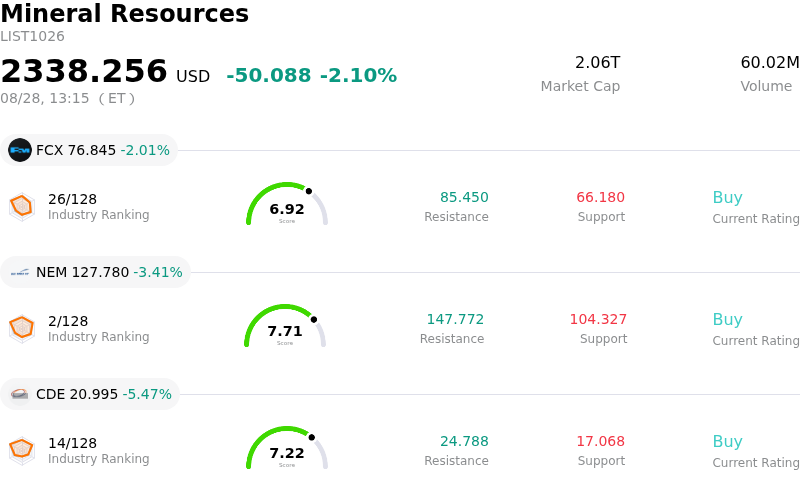
Newmont Corporation (NEM) moved down by 3.48%. The Mineral Resources sector is down by 2.10%. The company underperformed the industry. Top 3 stocks by turnover in the sector: Freeport-McMoRan Inc (FCX) down 2.01%; Newmont Corporation (NEM) down 3.41%; Coeur Mining Inc (CDE) down 5.47%.
What is driving Newmont Corporation (NEM)’s stock price down today?
Newmont Corporation experienced downward pressure as a combination of macroeconomic headwinds, commodity market retracement, and institutional profit-taking weighed on the precious metals sector. A primary catalyst driving the pullback was the weakness in spot gold prices, which retreated from recent highs ahead of key Federal Reserve commentary at the Jackson Hole symposium. Elevated U.S. personal consumption expenditures inflation data stoked expectations of persistent monetary tightness, spurring a recovery in the U.S. dollar and treasury yields. Because gold mining equities act as high-beta vehicles tied to underlying bullion prices, the contraction in spot gold directly reduced near-term revenue expectations for industry leaders like Newmont.
Beyond macroeconomic factors, fundamental valuation constraints and technical position adjustments contributed to the stock's lower movement. Following a multi-week rally powered by strong second-quarter earnings, record quarterly free cash flow, and the resolution of legacy joint venture disputes, Newmont's valuation had caught up to consensus analyst price targets. This rapid run-up prompted institutional investors to trim exposure and lock in gains. Furthermore, recent market research updates citing persistent operational cost pressures—such as sticky labor, diesel, and maintenance expenses impacting All-In Sustaining Costs—served as a damper on investor risk appetite.
Despite the intraday volatility, Newmont's underlying financial foundation remains solid. The company maintains a robust liquidity buffer, a healthy net cash position, and an active capital return program supported by asset divestment proceeds and share repurchases. Long-term organic growth projects in key mining jurisdictions also remain on track to expand production capacity. Consequently, market participants view the day's decline as a macro-driven sector consolidation and valuation reset rather than a structural shift in the company's long-term operating profile.
Technical Analysis of Newmont Corporation (NEM)
Technically, Newmont Corporation (NEM) shows a MACD (12,26,9) value of 1.488, indicating a buy signal. The RSI at 64.180 suggests neutral condition and the Williams %R at 34.121 suggests buy condition. Please monitor closely.
Media Coverage of Newmont Corporation (NEM)
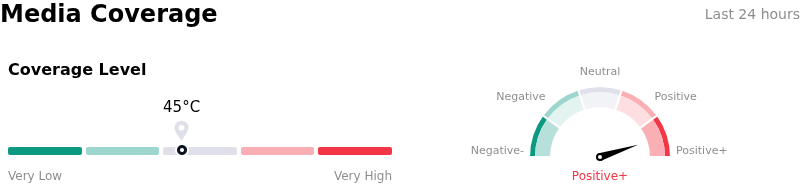
In terms of media coverage, Newmont Corporation (NEM) shows a coverage score of 45, indicating a moderate level of media attention. The overall market sentiment index is currently in extremely bullish zone.
Fundamental Analysis of Newmont Corporation (NEM)
Newmont Corporation (NEM) is in the Mineral Resources industry. Its latest annual revenue is $22.67B, ranking 8 in the industry. The net profit is $7.08B, ranking 3 in the industry. Company Profile
Over the past month, multiple analysts have rated the company as Buy, with an average price target of $133.58, a high of $205.00, and a low of $64.32.
More details about Newmont Corporation (NEM)
Company Specific Risks:
- Wall Street Valuation & Downgrade Pressure: Recent analyst rating downgrades to Hold and trimmed price targets highlight that NEM's valuation multiples have caught up with fundamentals, creating downside risk of valuation compression and profit-taking after the stock's recent price rally.
- Cost Pressures and Regional Tax Increases: Escalating energy and diesel expenses, combined with revised royalty taxation policies in key mining regions such as Ghana, are putting upward pressure on All-In Sustaining Costs (AISC) and squeezing operating margins.
- Production Volume Declines and Operational Disruptions: Strategic divestments of non-core assets and site transition challenges at major operations—including Cadia and Penasquito—have lowered projected full-year gold output, creating volume growth risk in 2026.
- Joint Venture Expenditure and Capital Outflows: Substantial near-term capital expenditure commitments for project expansions and joint venture restructuring require significant cash outflows, which may constrain immediate free cash flow generation.
This article may include AI-generated content that is human-reviewed, which is for reference and general information purposes only and does not constitute investment advice.
Recommended Articles









Comments (0)
Click the $ button, enter the symbol, and select to link a stock, ETF, or other ticker.