


Texas Instruments Inc Stock (TXN) Moved Down by 3.16% on Aug 28: Drivers Behind the Movement



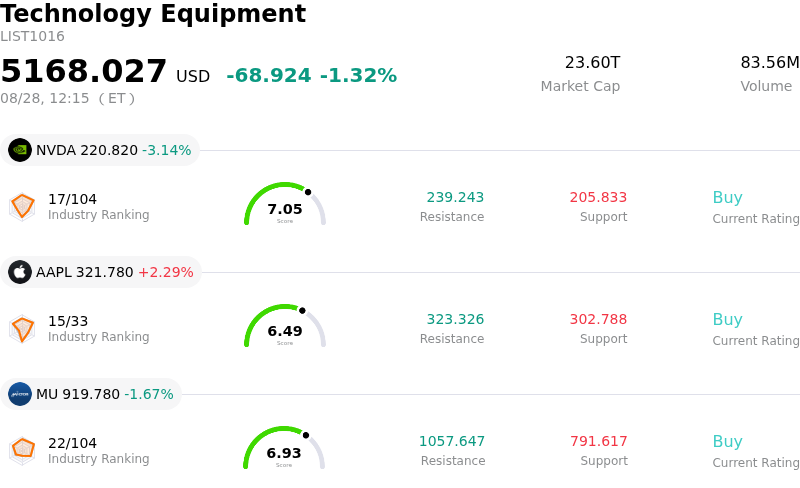
Texas Instruments Inc (TXN) moved down by 3.16%. The Technology Equipment sector is down by 1.32%. The company underperformed the industry. Top 3 stocks by turnover in the sector: NVIDIA Corp (NVDA) down 3.18%; Apple Inc (AAPL) up 2.15%; Micron Technology Inc (MU) down 1.81%.
What is driving Texas Instruments Inc (TXN)’s stock price down today?
Texas Instruments experienced notable downward pressure during the trading session, primarily driven by broad-based profit-taking across the semiconductor and broader technology sectors. Following an extended period of outperformance driven by expectations of an operational recovery across key end markets such as industrial, automotive, and data centers, institutional investors engaged in risk-off positioning. As market participants reevaluated valuations across elevated technology names, analog chipmaker shares faced selling pressure as part of a wider sector rotation.
Investors continue to balance Texas Instruments' operational recovery against its substantial multi-year capital investment program. The company has committed significant capital toward expanding its domestic 300-millimeter manufacturing capacity. While these strategic manufacturing investments position Texas Instruments for superior long-term cost efficiency and supply chain security, the substantial capital expenditures and structural depreciation costs continue to weigh on near-term free cash flow metrics during periods of market scrutiny. With traditional market multiples reflecting an optimistic earnings trajectory, the stock remains vulnerable to tactical profit-taking when sector-wide momentum cools.
From a structural perspective, market sentiment was further influenced by institutional portfolio adjustments and macro-driven yield dynamics impacting high-valuation technology equities. As macroeconomic data signals mixed trends in capital spending and end-market inventory normalization, institutional funds chose to trim exposure to capital-intensive hardware manufacturers. Despite solid long-term competitive advantages in analog and embedded processing, current price action underscores investor sensitivity to high capex commitments relative to near-term cash flow generation.
Technical Analysis of Texas Instruments Inc (TXN)
Technically, Texas Instruments Inc (TXN) shows a MACD (12,26,9) value of -1.747, indicating a sell signal. The RSI at 38.027 suggests neutral condition and the Williams %R at 92.334 suggests oversold condition. Please monitor closely.
Media Coverage of Texas Instruments Inc (TXN)
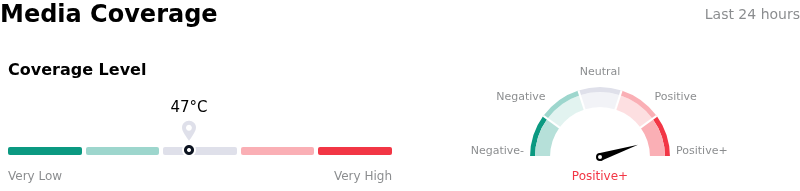
In terms of media coverage, Texas Instruments Inc (TXN) shows a coverage score of 47, indicating a moderate level of media attention. The overall market sentiment index is currently in extremely bullish zone.
Fundamental Analysis of Texas Instruments Inc (TXN)
Texas Instruments Inc (TXN) is in the Technology Equipment industry. Its latest annual revenue is $17.68B, ranking 14 in the industry. The net profit is $4.97B, ranking 10 in the industry. Company Profile
Over the past month, multiple analysts have rated the company as Buy, with an average price target of $309.53, a high of $400.00, and a low of $184.59.
More details about Texas Instruments Inc (TXN)
Company Specific Risks:
- Lagged Implementation of Price Hikes vs. Elevated Costs: Management initiated price increases across its analog and embedded product portfolios to offset manufacturing expenditures, but indicated that these price adjustments will not contribute to top-line revenue until the fourth quarter of 2026, exposing third-quarter margins to persistent input cost pressures.
- Executive Leadership Transition in Financial Management: The transition of the Chief Financial Officer role from long-standing CFO Rafael Lizardi to Julie Knecht, with Lizardi's advisory term concluding at the end of August 2026, introduces potential operational and financial execution risks during a heavy capital expenditure cycle.
- Stretched Premium Multiples relative to Intrinsic Cash Flow: Trading at a trailing earnings multiple near 32x and an estimated 8% premium over intrinsic discounted cash flow (DCF) model valuations, TXN remains vulnerable to sharp valuation compressions and institutional sell-offs if quarterly growth fails to track elevated Wall Street targets.
- Segment Contraction in Secondary End-Markets: While core industrial and data center segments demonstrated growth, TXN's "Other" revenue segment declined 2.2% year-over-year to $310 million, missing consensus model estimates and underscoring uneven recovery across smaller analog market segments.
This article may include AI-generated content that is human-reviewed, which is for reference and general information purposes only and does not constitute investment advice.
Recommended Articles









Comments (0)
Click the $ button, enter the symbol, and select to link a stock, ETF, or other ticker.