


Marvell Technology Inc Stock (MRVL) Opened Down by 6.96% on Aug 28: Facts Behind the Movement



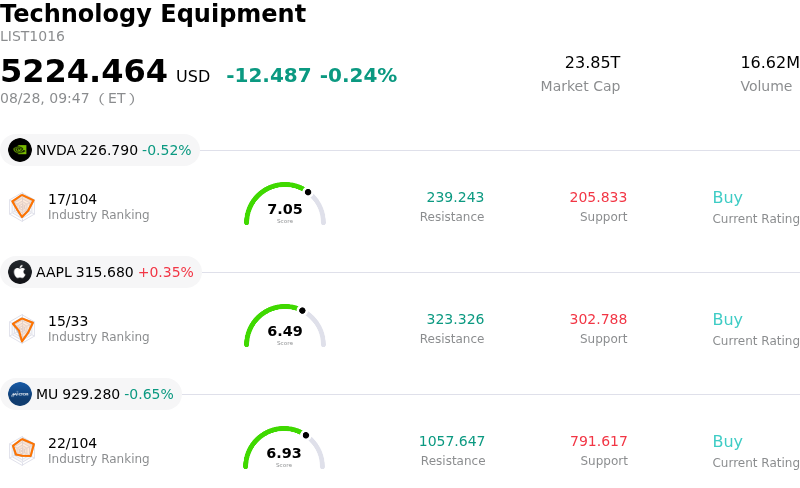
Marvell Technology Inc (MRVL) opened down by 6.96%. The Technology Equipment sector is down by 0.24%. The company underperformed the industry. Top 3 stocks by turnover in the sector: NVIDIA Corp (NVDA) down 0.33%; Apple Inc (AAPL) up 0.56%; Micron Technology Inc (MU) down 0.75%.
What is driving Marvell Technology Inc (MRVL)’s stock price down today?
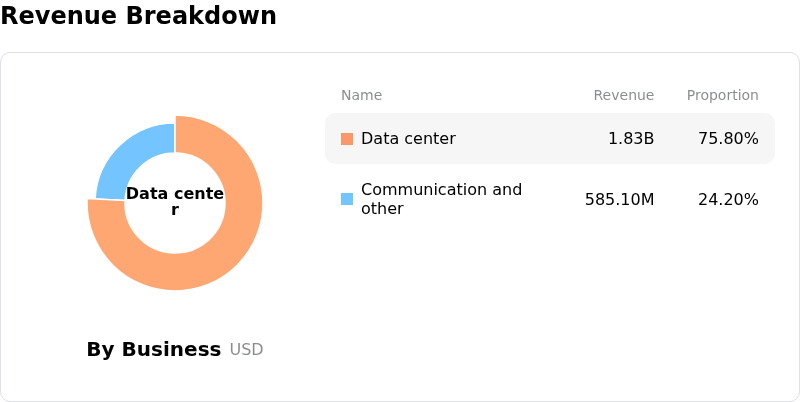
Marvell Technology experienced a notable downward movement following the release of its second-quarter fiscal 2027 financial results. While the semiconductor designer delivered solid headline figures—with revenue increasing significantly year-over-year to surpass market estimates alongside a modest beat on earnings per share—the market reaction was dominated by forward-looking expectations rather than past performance. Robust demand across its data center portfolio, driven by artificial intelligence networking and custom silicon demand, allowed management to raise its revenue outlook for both fiscal 2027 and fiscal 2028. However, these strong fundamental results were insufficient to sustain investor momentum in the short term.
The primary catalyst behind the selling pressure stems from heightened market expectations tied to the company's recent high-profile custom chip partnership with Alphabet's Google. Following the deal's announcement, investor enthusiasm had driven elevated expectations for an immediate financial windfall. On the post-earnings conference call, management clarified that while Google-related revenue is partially embedded in medium-term projections, the primary revenue contribution from this custom chip contract will not materialize until fiscal year 2029 and beyond. This longer-than-anticipated timeline disappointed market participants expecting faster monetization, prompting a re-evaluation of the near-term growth trajectory.
From an institutional standpoint, the pullback reflects a gap between elevated sentiment and long-dated fundamental execution. Marvell trades at a premium valuation relative to peer custom chipmakers, making the stock particularly sensitive to any perceived delay in growth realization. While Wall Street analysts generally maintained a constructive long-term view—highlighting structural tailwinds in custom artificial intelligence infrastructure and optical interconnects—the market chose to de-risk ahead of the company's upcoming investor event. For long-term market observers, the selloff represents a digestion of multi-year gains rather than a breakdown in core business fundamentals.
Technical Analysis of Marvell Technology Inc (MRVL)
Technically, Marvell Technology Inc (MRVL) shows a MACD (12,26,9) value of 3.313, indicating a buy signal. The RSI at 49.411 suggests neutral condition and the Williams %R at 64.355 suggests sell condition. Please monitor closely.
Media Coverage of Marvell Technology Inc (MRVL)
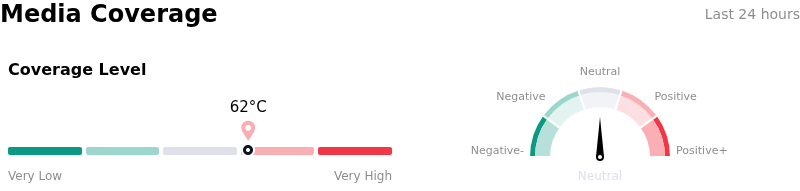
In terms of media coverage, Marvell Technology Inc (MRVL) shows a coverage score of 62, indicating a high level of media attention. The overall market sentiment index is currently in neutral zone.
Fundamental Analysis of Marvell Technology Inc (MRVL)
Marvell Technology Inc (MRVL) is in the Technology Equipment industry. Its latest annual revenue is $8.19B, ranking 19 in the industry. The net profit is $2.67B, ranking 13 in the industry. Company Profile
Over the past month, multiple analysts have rated the company as Buy, with an average price target of $264.47, a high of $400.00, and a low of $90.00.
More details about Marvell Technology Inc (MRVL)
Company Specific Risks:
- Sequential Gross Margin Compression: Management's Q3 non-GAAP gross margin guidance of 57.5%–58.5% reflects a sequential decline from 58.9% in Q2, driven by a product mix shift toward lower-margin custom silicon programs that is compressing near-term profitability metrics.
- Delayed Google Deal Monetization and Share Dilution: Shares faced selling pressure after management clarified that the primary financial impact of its high-profile Google AI partnership will not materialize until fiscal 2029, while the associated issuance of up to 58.97 million warrants creates near-term equity dilution risk.
- Elevated Valuation vs. Modest Operational Beat: Trading at a premium trailing P/E multiple exceeding 80x following a sharp pre-earnings run-up, the company's modest 1% quarterly revenue and earnings beat failed to satisfy elevated institutional expectations, triggering post-earnings profit taking.
- Vulnerability to Semiconductor Trade Tariffs: Recent intraday downside highlights market concern over external policy risks, as potential new U.S. semiconductor tariffs and supply chain constraints threaten high-end data center deployment schedules and component costs.
This article may include AI-generated content that is human-reviewed, which is for reference and general information purposes only and does not constitute investment advice.
Recommended Articles







Comments (0)
Click the $ button, enter the symbol, and select to link a stock, ETF, or other ticker.