


Anheuser-Busch Inbev SA Stock (BUD) Moved Down by 3.23% on Aug 17: Facts Behind the Movement



Anheuser-Busch Inbev SA (BUD) moved down by 3.23%. The Food & Beverages sector is down by 1.95%. The company underperformed the industry. Top 3 stocks by turnover in the sector: Heritage Distilling Holding Company Ord Shs (IPST) up 230.23%; Altria Group Inc (MO) down 2.40%; Coca-Cola Co (KO) down 0.91%.
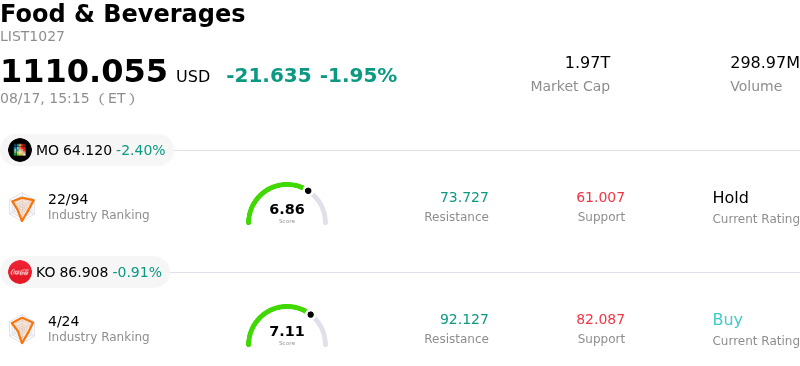
What is driving Anheuser-Busch Inbev SA (BUD)’s stock price down today?
Anheuser-Busch InBev experienced notable downward price pressure and heightened intraday volatility as market participants engaged in profit-taking following a multi-week rally. After delivering strong second-quarter financial results that exceeded top-line and bottom-line expectations, the stock experienced a phase of consolidation as investors locked in gains. A central driver of this pullback is investor scrutiny over operating margins and elevated promotional spend. Despite solid pricing power, premiumization strategies, and rapid expansion in non-alcoholic categories, heavy capital deployment toward commercial initiatives—including major global sports sponsorships and brand repositioning—has raised concerns regarding near-term margin expansion.
Regional performance disparities have further weighed on market sentiment. While volume growth across Latin American and Western markets has remained relatively resilient, persistent volume weakness across key Asian markets, particularly in China, continues to hinder a unified global volume recovery. This geographic divergence has led institutional investors to adopt a more cautious stance, questioning whether volume momentum in softer regions can recover sufficiently to offset near-term promotional costs.
Technical factors also contributed to the selling momentum during the session. The breach of key short-term moving averages and negative momentum crossovers triggered automated trading signals, accelerating intraday downside momentum. While sell-side consensus ratings and long-term earnings estimates remain generally supportive due to the company's strong brand portfolio and disciplined capital allocation, short-term sentiment remains constrained by broader consumer staples sector profit-taking and macroeconomic cautiousness regarding discretionary consumer spending.
Technical Analysis of Anheuser-Busch Inbev SA (BUD)
Technically, Anheuser-Busch Inbev SA (BUD) shows a MACD (12,26,9) value of -1.198, indicating a neutral signal. The RSI at 41.859 suggests neutral condition and the Williams %R at 87.964 suggests oversold condition. Please monitor closely.
Fundamental Analysis of Anheuser-Busch Inbev SA (BUD)
Anheuser-Busch Inbev SA (BUD) is in the Food & Beverages industry. Its latest annual revenue is $59.32B, ranking 2 in the industry. The net profit is $6.84B, ranking 3 in the industry. Company Profile
Over the past month, multiple analysts have rated the company as Buy, with an average price target of $97.06, a high of $105.00, and a low of $89.00.
More details about Anheuser-Busch Inbev SA (BUD)
Company Specific Risks:
- Asia-Pacific Volume and Earnings Contraction: Weak consumer demand and broader industry contraction in key markets like China contributed to an H1 volume decline of 2.8% and a 10.0% drop in normalized EBITDA across the Asia-Pacific region, presenting ongoing geographic headwinds.
- Operating Margin Pressure from Elevated Commercial Spending: Increased scrutiny from market analysts highlights that aggressive commercial deployment—including heavy promotional spending and substantial marketing outlays for global sports platform sponsorships—is capping operating margin leverage despite overall top-line revenue growth.
- Foreign Exchange Headwinds in Emerging Markets: High operational exposure to Latin America and hyperinflationary markets such as Argentina continues to generate significant transactional foreign exchange pressure, eroding currency translation gains and threatening net profit stability.
- Substantial Debt Load and Elevated Financial Leverage: Holding $64.2 billion in net debt with a net debt-to-normalized EBITDA ratio of 2.86x, the company remains burdened by high interest expense obligations that limit strategic capital allocation and increase vulnerability to macroeconomic fluctuations.
This article may include AI-generated content that is human-reviewed, which is for reference and general information purposes only and does not constitute investment advice.
Recommended Articles









Comments (0)
Click the $ button, enter the symbol, and select to link a stock, ETF, or other ticker.