


Fortinet Inc Stock (FTNT) Closed Down by 3.41% on Aug 14: A Full Analysis



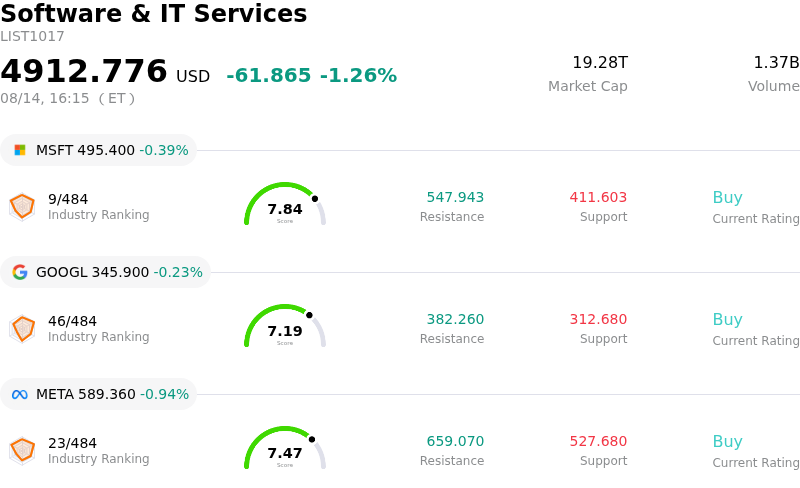
Fortinet Inc (FTNT) closed down by 3.41%. The Software & IT Services sector is down by 1.26%. The company underperformed the industry. Top 3 stocks by turnover in the sector: Microsoft Corp (MSFT) down 0.39%; Alphabet Inc Class A (GOOGL) down 0.23%; Meta Platforms Inc (META) down 0.94%.
What is driving Fortinet Inc (FTNT)’s stock price down today?
Fortinet experienced downward price pressure and heightened intraday volatility as short-term profit-taking accelerated following an extended multi-week rally. After reaching new multi-year highs earlier in the month driven by robust second-quarter earnings and an upgraded full-year financial guidance, the stock became increasingly susceptible to valuation fatigue. Institutional investors and market participants began reassessing the company's valuation metrics, which indicated that the equity was trading at a premium relative to intrinsic discounted cash flow models and historical industry multiples.
Underpinning the sell-off are underlying debates regarding the long-term sustainability of the current hardware refresh cycle. While demand for specialized security processing units and integrated enterprise firewalls has fueled strong top-line momentum, market commentary highlighted potential headwinds if hardware upgrade momentum tapers in subsequent quarters. Additionally, investor sentiment has been tempered by a perceived disconnect between rapid product revenue growth and relatively modest expansion in high-margin subscription service revenues, raising questions regarding ongoing customer attach rates and recurring service conversion.
Broader market conditions within the software and cybersecurity sectors also contributed to choppy trading activity. Recent regulatory disclosures detailing routine executive stock plan executions and administrative equity grants coincided with a broader macro environment where market participants trimmed exposure to high-multiple technology growth assets. Consequently, the convergence of stretched valuations, fundamental durability concerns, and sector-wide portfolio rebalancing drove the pullback in the share price during the session.
Technical Analysis of Fortinet Inc (FTNT)
Technically, Fortinet Inc (FTNT) shows a MACD (12,26,9) value of -0.003, indicating a neutral signal. The RSI at 58.970 suggests neutral condition and the Williams %R at 23.482 suggests buy condition. Please monitor closely.
Media Coverage of Fortinet Inc (FTNT)
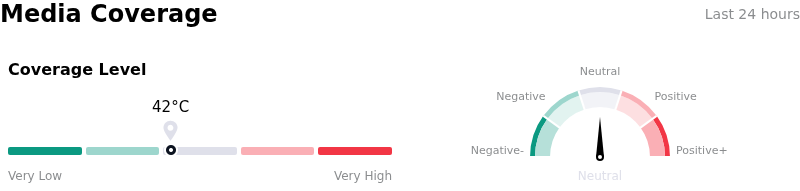
In terms of media coverage, Fortinet Inc (FTNT) shows a coverage score of 42, indicating a moderate level of media attention. The overall market sentiment index is currently in neutral zone.
Fundamental Analysis of Fortinet Inc (FTNT)
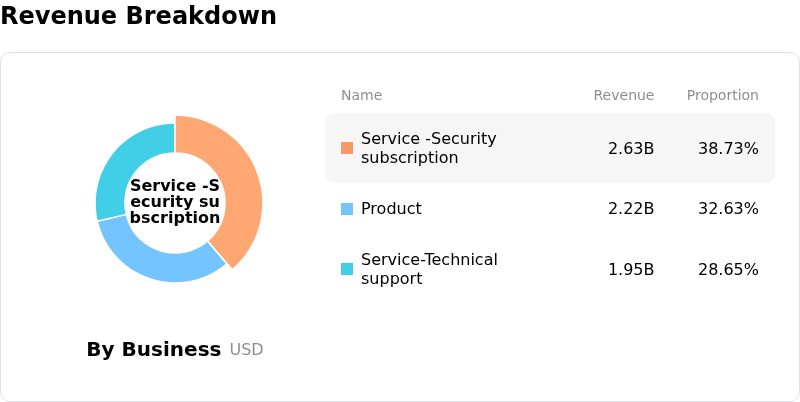
Fortinet Inc (FTNT) is in the Software & IT Services industry. Its latest annual revenue is $6.80B, ranking 49 in the industry. The net profit is $1.85B, ranking 29 in the industry. Company Profile
Over the past month, multiple analysts have rated the company as Hold, with an average price target of $158.96, a high of $220.00, and a low of $86.00.
More details about Fortinet Inc (FTNT)
Company Specific Risks:
- Critical Security Vulnerabilities in Core Software: Fortinet recently disclosed patches for eight security flaws across its product lineup, including high-severity authentication bypass vulnerabilities in FortiWeb (CVE-2026-26035) and FortiManager (CVE-2026-70468), alongside a Windows FortiClient code-execution defect, raising operational concerns and exposing corporate client deployments to unauthorized access risks.
- Elevated Valuation Premium and Overbought Metrics: Following a year-to-date rally that pushed shares to all-time highs above $170, the stock trades at elevated valuation multiples—roughly 60x price-to-earnings and 16x–18x price-to-sales—leaving it highly susceptible to sharp valuation multiple compression given independent fair-value targets well below current trading prices.
- Maturing Hardware Firewall Refresh Cycle: Analyst commentary underscores the threat of revenue and margin deceleration once the current firewall upgrade cycle crests, as slowing hardware billings could impair operating leverage if recurring software and SASE (Secure Access Service Edge) revenues fail to bridge the gap.
- High-Volume Executive Insider Stock Liquidations: SEC filings and insider disclosures indicating multi-million dollar share sales by key executives, including CEO Ken Xie, have amplified institutional caution and triggered profit-taking volatility near historic highs.
This article may include AI-generated content that is human-reviewed, which is for reference and general information purposes only and does not constitute investment advice.
Recommended Articles










Comments (0)
Click the $ button, enter the symbol, and select to link a stock, ETF, or other ticker.