


Ge Vernova Inc Stock (GEV) Moved Up by 4.29% on Jul 23: What Signal Does It Send?



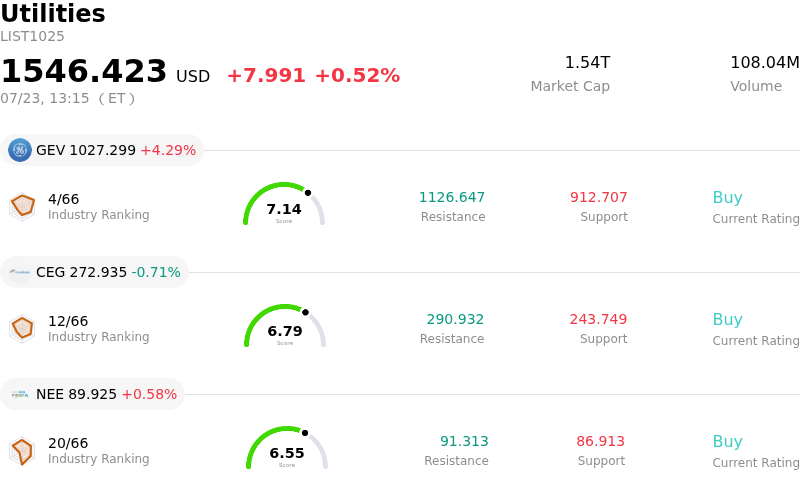
Ge Vernova Inc (GEV) moved up by 4.29%. The Utilities sector is up by 0.52%. The company outperformed the industry. Top 3 stocks by turnover in the sector: Ge Vernova Inc (GEV) up 4.29%; Constellation Energy Corp (CEG) down 0.71%; Nextera Energy Inc (NEE) up 0.58%.
What is driving Ge Vernova Inc (GEV)’s stock price up today?
GE Vernova's upward trajectory is primarily driven by its second-quarter 2026 earnings release, which showcased robust margin expansion across its Power and Electrification segments. Institutional investors are reacting positively to the company's ability to convert a record-high backlog into realized revenue, particularly as global demand for grid infrastructure upgrades intensifies. The significant intraday volatility suggests a tug-of-war between profit-takers and long-term buyers, but the prevailing bullish sentiment indicates that the underlying fundamental health of the business is outweighing short-term technical resistance.
The surge in buying activity is further supported by the accelerating demand for power generation equipment fueled by the rapid expansion of artificial intelligence data centers. As a market leader in gas turbines and grid solutions, GE Vernova is positioned as a primary beneficiary of the multi-decade electrification trend. Analysts have been upwardly revising their price targets following data that shows a tighter supply chain for high-voltage transformers and power equipment, giving the company increased pricing power that was not fully reflected in previous valuation models.
A critical component of the positive movement is the visible turnaround in the Wind segment. After several quarters of restructuring and focus on operational efficiency, the segment has reached a profitability inflection point. This shift from a drag on earnings to a contributor of cash flow has triggered a re-rating by several investment banks. Market sentiment is also being bolstered by the broader rotation into industrial and energy infrastructure stocks as macroeconomic data suggests a stabilization in interest rates, which lowers the capital cost for large-scale utility projects.
From a portfolio management perspective, the volatility observed today reflects institutional rebalancing as the stock continues to gain weight in key industrial and green energy ETFs. The combination of strong guidance for the remainder of the fiscal year and a narrowing of operational risks has solidified investor confidence. While geopolitical tensions and currency fluctuations remain peripheral risks, the localized nature of grid investments provides a defensive moat that continues to attract capital away from more cyclical sectors.
Technical Analysis of Ge Vernova Inc (GEV)
Technically, Ge Vernova Inc (GEV) shows a MACD (12,26,9) value of -20.076, indicating a neutral signal. The RSI at 41.677 suggests neutral condition and the Williams %R at 98.584 suggests oversold condition. Please monitor closely.
Media Coverage of Ge Vernova Inc (GEV)
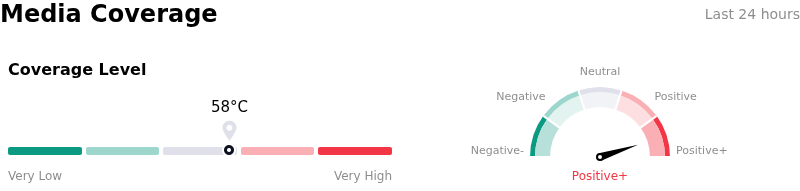
In terms of media coverage, Ge Vernova Inc (GEV) shows a coverage score of 58, indicating a moderate level of media attention. The overall market sentiment index is currently in extremely bullish zone.
Fundamental Analysis of Ge Vernova Inc (GEV)
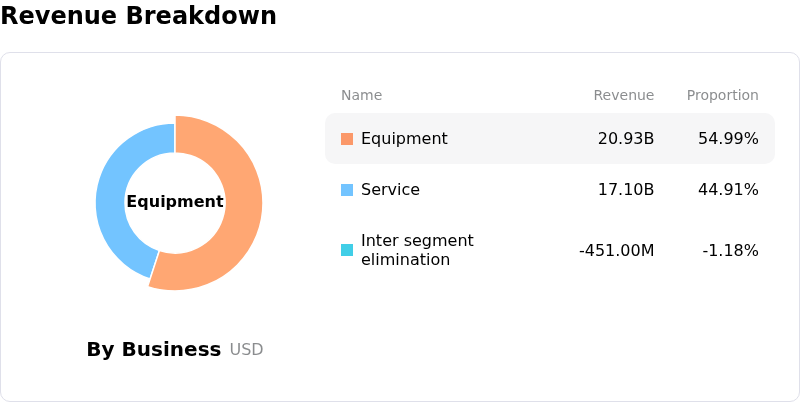
Ge Vernova Inc (GEV) is in the Utilities industry. Its latest annual revenue is $38.07B, ranking 2 in the industry. The net profit is $4.88B, ranking 4 in the industry. Company Profile
Over the past month, multiple analysts have rated the company as Buy, with an average price target of $1213.20, a high of $1424.00, and a low of $836.00.
More details about Ge Vernova Inc (GEV)
Company Specific Risks:
- Wind Segment Profitability Lag: Sustained margin compression within the offshore wind division as management works through an unprofitable multi-billion dollar legacy backlog, which remains highly sensitive to inflationary pressures and high-cost logistics.
- Product Reliability and Warranty Exposure: Heightened risk of warranty-related charges and technical remediation costs following mechanical failures in newer turbine models, which could necessitate significant capital outlays to maintain fleet performance guarantees.
- Grid Component Supply Bottlenecks: Potential revenue recognition delays in the Grid Solutions business due to global shortages of critical raw materials and high-voltage components, hindering the company's ability to capitalize on the current surge in electrical infrastructure demand.
- Operational Execution and Standalone Costs: Ongoing friction related to the recent corporate spin-off, including the transition to independent operational systems and the realization of higher-than-expected corporate overhead that could impact near-term EBITDA targets.
This article may include AI-generated content that is human-reviewed, which is for reference and general information purposes only and does not constitute investment advice.
Recommended Articles










Comments (0)
Click the $ button, enter the symbol, and select to link a stock, ETF, or other ticker.