


CME Group Inc Stock (CME) Moved Up by 5.96% on Jul 22: Key Drivers Unveiled



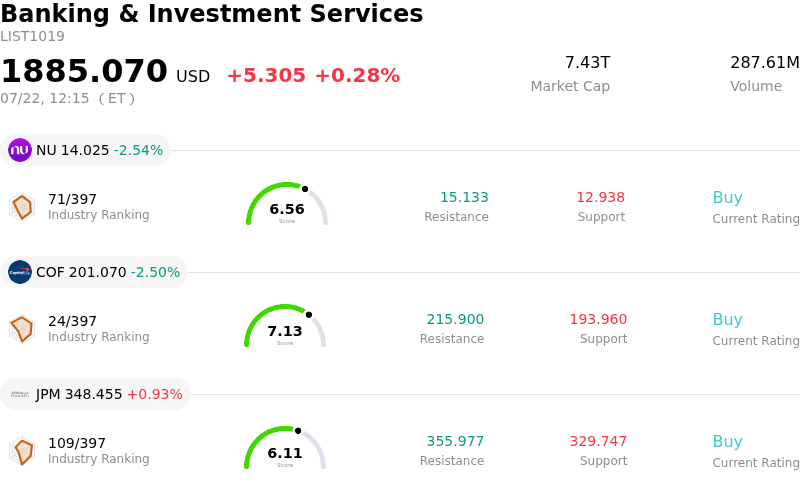
CME Group Inc (CME) moved up by 5.96%. The Banking & Investment Services sector is up by 0.28%. The company outperformed the industry. Top 3 stocks by turnover in the sector: Nu Holdings Ltd (NU) down 2.54%; Capital One Financial Corp (COF) down 2.50%; JPMorgan Chase & Co (JPM) up 0.95%.
What is driving CME Group Inc (CME)’s stock price up today?
The upward momentum in CME Group's valuation today is primarily driven by a robust second-quarter earnings report that exceeded institutional expectations across several key metrics. The exchange operator reported a significant surge in clearing and transaction fee revenue, bolstered by record average daily volumes in interest rate and energy products. As the primary venue for global risk management, CME benefited from heightened market activity as institutional participants recalibrated portfolios in response to shifting global economic conditions.
Macroeconomic factors have played a decisive role in fueling this volatility-linked growth. Persistent uncertainty regarding central bank policy trajectories has led to increased hedging activity in the Treasury futures and SOFR markets. Additionally, the expansion of the company's suite of short-term interest rate products has captured a larger share of the professional trading market. This surge in volume directly translates to improved operating margins, as the exchange’s scalable infrastructure allows for incremental revenue with minimal corresponding increases in fixed costs.
Market sentiment has also been bolstered by positive revisions from several top-tier equity analysts who raised their price targets following the earnings call. Investors reacted favorably to management's commentary on the continued integration of cloud-based trading technologies, which is expected to enhance data distribution and reduce latency for high-frequency participants. This technological evolution, combined with the company's commitment to returning capital through its variable dividend policy, has reinforced CME's position as a core defensive play within the financial services sector.
From a structural perspective, the intraday volatility reflects a broader rotation back into high-quality financial infrastructure stocks. As investors seek exposure to platforms that capitalize on market turbulence rather than being victimized by it, CME stands out as a primary beneficiary. The combination of strong fundamental performance, favorable macro tailwinds, and disciplined capital allocation has created a powerful catalyst for the current upward price action, signaling strong institutional confidence in the firm's long-term earnings power.
Technical Analysis of CME Group Inc (CME)
Technically, CME Group Inc (CME) shows a MACD (12,26,9) value of 4.091, indicating a neutral signal. The RSI at 41.506 suggests neutral condition and the Williams %R at 41.919 suggests buy condition. Please monitor closely.
Media Coverage of CME Group Inc (CME)
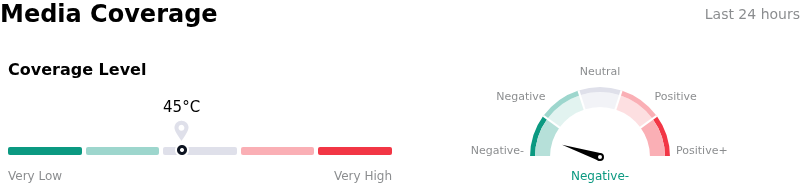
In terms of media coverage, CME Group Inc (CME) shows a coverage score of 45, indicating a moderate level of media attention. The overall market sentiment index is currently in extremely bearish zone.
Fundamental Analysis of CME Group Inc (CME)
CME Group Inc (CME) is in the Banking & Investment Services industry. Its latest annual revenue is $11.95B, ranking 19 in the industry. The net profit is $4.02B, ranking 8 in the industry. Company Profile
Over the past month, multiple analysts have rated the company as Hold, with an average price target of $282.25, a high of $324.00, and a low of $226.00.
More details about CME Group Inc (CME)
Company Specific Risks:
- Intensifying Competitive Pressure: The recent regulatory advancement and impending launch of the FMX Futures Exchange, backed by a consortium of major investment banks, poses a direct structural threat to CME’s dominant market share in U.S. Treasury and SOFR futures products.
- Monetary Policy Volume Risk: Recent shifts in Federal Reserve messaging have led to periods of reduced interest rate volatility, creating concern among institutional analysts that a "higher-for-longer" plateau will result in a significant year-over-year decline in interest rate trading volumes.
- Regulatory Capital Scrutiny: Ongoing discussions regarding increased "skin-in-the-game" requirements for clearinghouses may force CME to allocate more of its own capital to default funds, potentially limiting the cash available for the company’s historical pattern of special dividend distributions.
- Fee and Margin Compression: In response to emerging competition from rival exchanges, CME faces the immediate risk of being forced to offer aggressive volume-based rebates or lower transaction fees, which would negatively impact the high-margin Clearing and Transaction Fee revenue segment.
This article may include AI-generated content that is human-reviewed, which is for reference and general information purposes only and does not constitute investment advice.
Recommended Articles










Comments (0)
Click the $ button, enter the symbol, and select to link a stock, ETF, or other ticker.