


Ethereum (ETHUSD) Is down 1.95% on Jul 16: Key Drivers to Watch



Ethereum (ETHUSD) is down 1.95% at Jul 16 04:15(ET), now at $1883.82, with a 7-day up of 7.88%.
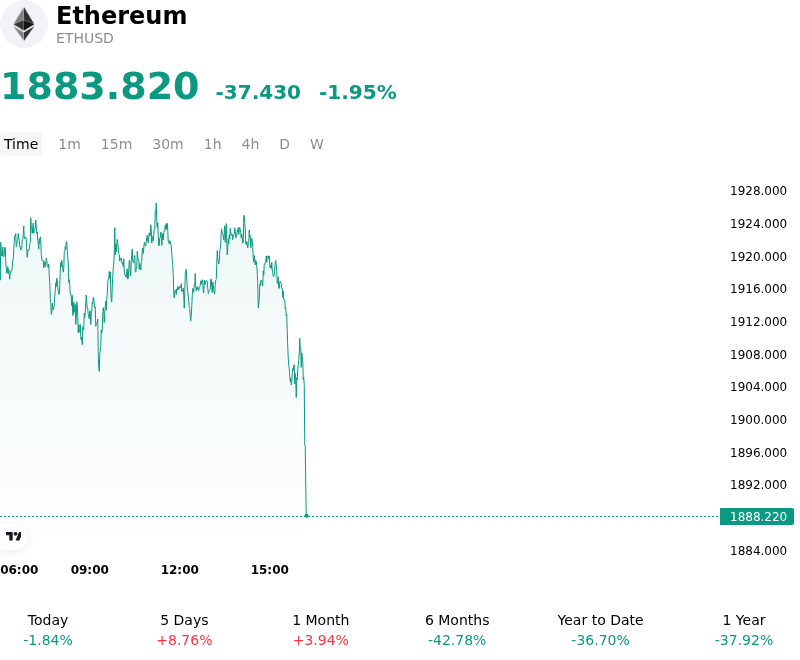
What is driving Ethereum (ETHUSD)’s stock price down today?
Ethereum is experiencing downward pressure primarily driven by a shift in global macro liquidity conditions and a corresponding recalibration of institutional risk appetite. Rising US Treasury yields, bolstered by recent economic data suggesting persistent inflationary pressures, have strengthened the US Dollar and increased the opportunity cost of holding non-yielding or yield-variable digital assets. This macro-driven rotation has led to a cooling of sentiment among institutional allocators who had previously been aggressive in their accumulation of Ethereum as a core portfolio component.
A significant catalyst for the current price action is the observed reversal in Spot Ethereum ETF flows. After a period of sustained net inflows, recent data indicates a pivot toward net outflows, suggesting that institutional desks are paring back exposure in response to tightening financial conditions. This shift in capital flows is a direct reflection of broader market uncertainty regarding the Federal Reserve's interest rate trajectory. As traditional fixed-income instruments offer more competitive risk-adjusted returns, the narrative surrounding Ethereum’s staking yield as an institutional-grade alternative has faced temporary headwinds.
On-chain activity further supports this cautious outlook, with a notable increase in the volume of ETH moving onto centralized exchanges. This uptick in exchange-inflow mean suggests that larger holders are positioning for liquidity, potentially to hedge against further downside or to rebalance portfolios in a high-yield environment. Furthermore, the derivatives market has seen a reduction in open interest and a softening of funding rates, indicating a lack of conviction among long-biased traders and an increase in protective hedging activity.
From a structural perspective, the decline appears to be a liquidity-driven repricing rather than a reflection of network-specific failures. While Layer-2 adoption and protocol-level activity remain robust, the asset’s valuation remains highly sensitive to the global M2 money supply and the cost of capital. Investors are currently monitoring the resilience of decentralized finance protocols and the pace of institutional integration, but the immediate trend is being dictated by the broader de-risking sentiment prevalent in global financial markets.
The primary risk remains the potential for further hawkish surprises from central banks, which could exacerbate the contraction of liquidity and lead to additional deleveraging in the crypto-asset space. As Ethereum remains a primary benchmark for the broader digital asset ecosystem, its performance continues to be a bellwether for institutional sentiment and the overall health of decentralized capital markets.
Technical Analysis of Ethereum (ETHUSD)
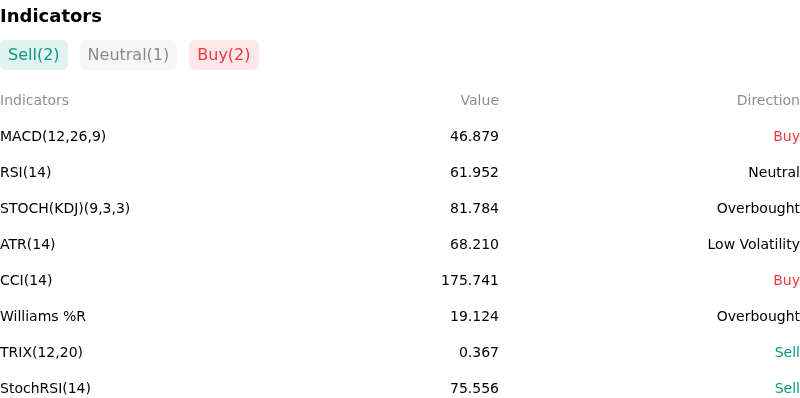
Technically, Ethereum (ETHUSD) shows a MACD (12,26,9) value of 46.879, indicating a buy signal. The RSI at 61.952 suggests neutral condition and the Williams %R at 19.124 suggests overbought condition. Please monitor closely.
More details about Ethereum (ETHUSD)
Recent Events and Risks:
- Institutional Sell-Side Pressure: Recent data indicates sustained net outflows from the Grayscale Ethereum Trust (ETHE), creating a persistent supply overhang that necessitates significant buy-side volume from newer spot ETFs to maintain price stability.
- Supply Inflation Dynamics: A notable decline in Ethereum mainnet transaction fees over the last 48 hours has resulted in a reduced ETH burn rate, causing the total supply to become inflationary and undermining the scarcity narrative that typically supports the asset's valuation during periods of low demand.
- Foundation and Whale Liquidations: On-chain monitoring has detected significant movements of ETH from Ethereum Foundation-linked wallets and prominent whale addresses to centralized exchanges within the last 72 hours, signaling potential near-term liquidations and increasing sell-side liquidity.
- Concentrated Liquidation Risk: A buildup of leveraged long positions in the perpetual futures market, combined with a slight uptick in funding rates, has heightened the risk of a liquidation cascade if the price breaks below immediate technical support levels, potentially accelerating intraday downside volatility.
This article may include AI-generated content that is human-reviewed, which is for reference and general information purposes only and does not constitute investment advice.
Recommended Articles









Comments (0)
Click the $ button, enter the symbol, and select to link a stock, ETF, or other ticker.