


Costco Wholesale Corp Stock (COST) Moved Down by 4.47% on Jul 9: What Signal Does It Send?



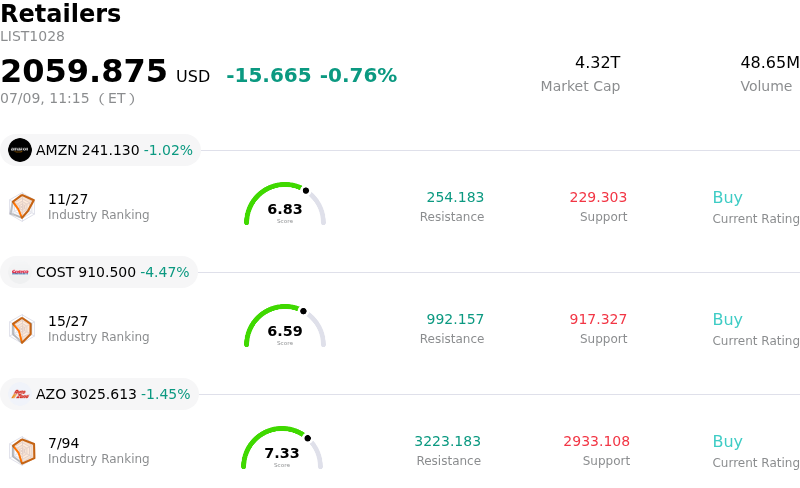
Costco Wholesale Corp (COST) moved down by 4.47%. The Retailers sector is down by 0.76%. The company underperformed the industry. Top 3 stocks by turnover in the sector: Amazon.com Inc (AMZN) down 1.02%; Costco Wholesale Corp (COST) down 4.47%; Autozone Inc (AZO) down 1.45%.
What is driving Costco Wholesale Corp (COST)’s stock price down today?
Costco Wholesale Corporation experienced downward stock pressure today despite releasing robust monthly sales data. In its June retail sales report, the membership warehouse operator recorded strong net sales growth of 10.6% year-over-year. Comparable sales increased by 8.8% overall, with a stellar 20.9% jump in digitally-enabled e-commerce transactions. Additionally, the board declared a quarterly cash dividend. Despite these seemingly positive fundamental catalysts, the market responded with a sell-off.
The negative reaction is heavily tied to valuation and the concept of priced-in expectations. Trading at a highly elevated forward price-to-earnings ratio of roughly 42 times, Wall Street already expects consistent high-single to low-double-digit growth from the retailer. Because the June sales figures merely met expectations without offering a major upside surprise, investors used the news as an opportunity for profit-taking. This dynamic illustrates that exceptional operational performance has become the baseline expectation for Costco, rather than a driver for further near-term price appreciation.
Furthermore, the stock faces stiff technical resistance. Having repeatedly failed to break above a descending trendline, the lack of an earnings or sales beat left the shares vulnerable to technical selling pressure. Investors are also turning their focus to broader risks, including potential tariff changes and consumer spending sustainability. With no immediate positive catalyst to justify its premium valuation multiple, the stock moved lower as the market consolidated gains.
Technical Analysis of Costco Wholesale Corp (COST)
Technically, Costco Wholesale Corp (COST) shows a MACD (12,26,9) value of 2.786, indicating a neutral signal. The RSI at 45.808 suggests neutral condition and the Williams %R at 48.417 suggests neutral condition. Please monitor closely.
Media Coverage of Costco Wholesale Corp (COST)
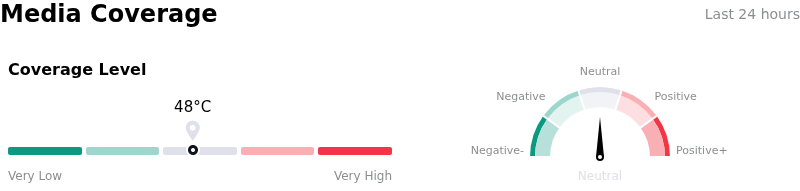
In terms of media coverage, Costco Wholesale Corp (COST) shows a coverage score of 48, indicating a moderate level of media attention. The overall market sentiment index is currently in neutral zone.
Fundamental Analysis of Costco Wholesale Corp (COST)
Costco Wholesale Corp (COST) is in the Retailers industry. Its latest annual revenue is $275.24B, ranking 2 in the industry. The net profit is $8.10B, ranking 2 in the industry. Company Profile
Over the past month, multiple analysts have rated the company as Buy, with an average price target of $1077.32, a high of $1315.00, and a low of $658.22.
More details about Costco Wholesale Corp (COST)
Company Specific Risks:
- Decelerating Comparable Sales and Missed Targets: Costco’s June 2026 comparable sales growth of 8.8% fell short of analyst forecasts (such as Telsey's expectation of 10.6%) and marked a notable deceleration from the 12.5% comp-store sales growth recorded in May 2026.
- Valuation Premium Vulnerabilities: Institutional analysts at Wolfe Research, Guggenheim, DA Davidson, and Citi have maintained neutral ratings on the stock, citing extreme valuation pressures. Trading at an elevated forward price-to-earnings (P/E) multiple of over 42x to 48x, the stock remains highly vulnerable to pullbacks on any minor growth or sentiment misses.
- Regional Growth Divergence and International Softness: While domestic U.S. comparable sales remained resilient, international and regional growth showed relative softness, with Canada's comparable sales rising just 3.7% in June, exposing the company to geographic fluctuations, currency tailwinds, and varied consumer spending dynamics.
- Exposed Sensitivity to Deflationary Macro Forces: Underlying comparable sales metrics remain highly sensitive to volatile external headwinds, including gasoline price deflation, currency exchange rate fluctuations, and localized warehouse cannibalization, which negatively impacted June core comparable sales metrics.
This article may include AI-generated content that is human-reviewed, which is for reference and general information purposes only and does not constitute investment advice.
Recommended Articles








Comments (0)
Click the $ button, enter the symbol, and select to link a stock, ETF, or other ticker.