


Solana (SOLUSD) Is down 1.01% on Jul 6: Why It Happened



Solana (SOLUSD) is down 1.01% at Jul 6 01:35(ET), now at $79.26, with a 7-day up of 6.58%.
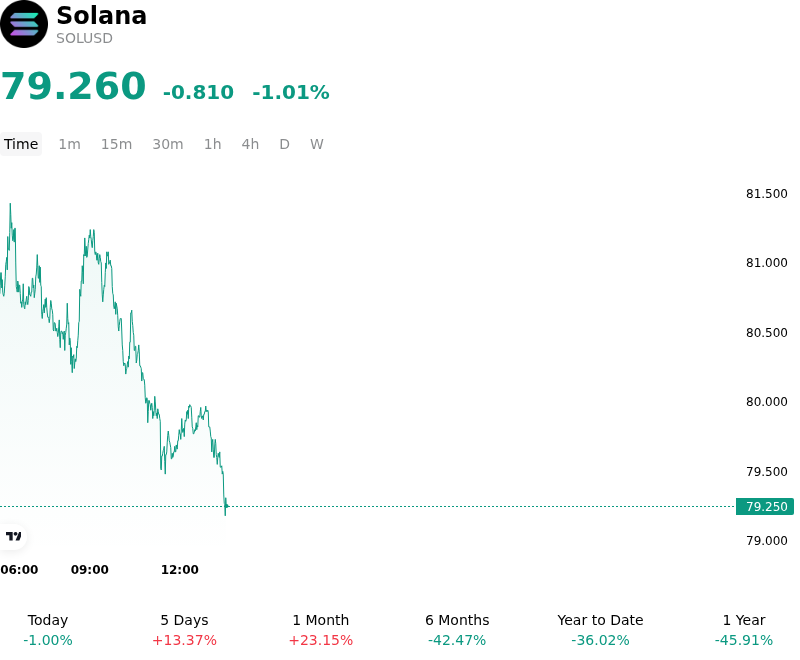
What is driving Solana (SOLUSD)’s stock price down today?
Solana experienced a minor decline as short-term profit-taking, token unlocks, and structured derivative flushes overshadowed a broader macro-driven crypto market recovery.
Despite a positive macroeconomic shift following softer-than-expected US nonfarm payrolls, which lowered rate hike expectations and pushed capital into major assets like Bitcoin, the altcoin market has continued to battle structural capital outflows. For Solana, the immediate downside pressure was driven by localized supply concerns. Investors faced ongoing anxiety over pending token unlocks scheduled for the month, alongside the persistent risk of spot market distribution from the bankrupt FTX estate's remaining assets. This supply overhang limited the upside potential near key technical resistance zones.
Furthermore, on-chain data pointed to temporary capital drains. Large-scale holders moved approximately 600,000 SOL to centralized exchanges over the preceding days, signaling elevated near-term selling pressure as whales potentially positioned to liquidate positions. This increase in exchange-bound liquidity came as early buyers locked in profits following a sharp relief rally earlier in the week.
In the derivatives market, Solana faced a cleaner flush of leveraged positions. Unlike major counterparts where liquidations heavily squeezed short sellers, Solana experienced a higher concentration of long liquidations. Leverage remained heavily skewed toward long positions on retail venues. When the spot price failed to decisively break and hold above the psychological and technical resistance range of eighty to eighty-five dollars, these leveraged long positions were caught in a localized cascade, accelerating the intraday slide back toward key support targets.
Broader institutional participation also remained highly cautious, limiting the network's ability to sustain its upward momentum. While spot Solana ETFs had previously amassed notable inflows, institutional net additions have slowed significantly as professional allocators wait for clearer long-term macroeconomic signals and regulatory clarity. This has left Solana highly dependent on speculative, retail-driven on-chain volumes from meme coin launchpads and decentralized applications, which—despite driving transactions and active users to yearly highs—failed to translate into sustainable, spot-driven buying pressure for the underlying token.
Technical Analysis of Solana (SOLUSD)
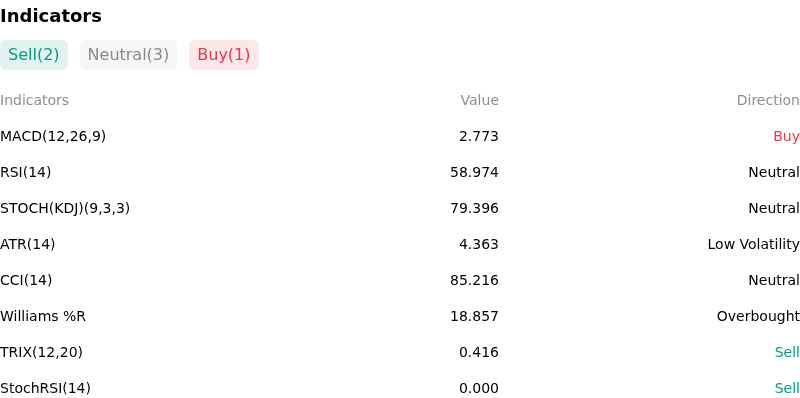
Technically, Solana (SOLUSD) shows a MACD (12,26,9) value of 2.773, indicating a buy signal. The RSI at 58.974 suggests neutral condition and the Williams %R at 18.857 suggests overbought condition. Please monitor closely.
More details about Solana (SOLUSD)
Recent Events and Risks:
- Crowded Leverage and Squeeze Risk: Market positioning has become highly skewed toward leveraged longs, exemplified by a newly funded wallet initiating a massive 20x long position of 230,583 SOL (valued at $18.81 million). With Binance top trader accounts heavily long (64.71% long vs. 35.29% short) and the largest concentration of leveraged liquidity clustered tightly around the $80 level, any sudden downward move below $80 risks triggering cascading liquidations.
- Institutional Whale Capitulation and Outflows: Concerns over whale distribution persist following a significant transaction where corporate treasury holder Forward Industries transferred 455,784 SOL (worth approximately $31.9 million) to Coinbase Prime. This movement to an exchange, coupled with a recent reversal in U.S. spot Solana ETFs turning into net weekly outflows, indicates a decline in institutional risk appetite.
- Ecosystem Token Unlock Overhang: The broader Solana network faces structural sell-side pressure from a heavy July unlock schedule. Fourteen Solana-based tokens are slated to unlock throughout the month, led by the PUMP token on July 12, which will introduce $123.65 million worth of tokens (a 21.35% increase in circulating supply) into the ecosystem, threatening to drain secondary liquidity from SOL.
- Bearish Multi-Month Trend and Technical Barriers: Despite recent minor bounces, SOL continues to operate under a dominant bearish macro structure, having closed its ninth consecutive red month and sitting approximately 72% below its previous peak. The daily chart is capped by heavy overhead moving averages (including the 100-day and 200-day EMAs), and a failure to decisively break and hold above the $80–$82 resistance zone threatens to drive prices back to the critical $63 support level or lower.
This article may include AI-generated content that is human-reviewed, which is for reference and general information purposes only and does not constitute investment advice.
Recommended Articles









Comments (0)
Click the $ button, enter the symbol, and select to link a stock, ETF, or other ticker.