

Bitcoin (BTCUSD) Is up 1.10% on Jul 3: What Are the Risk Factors?

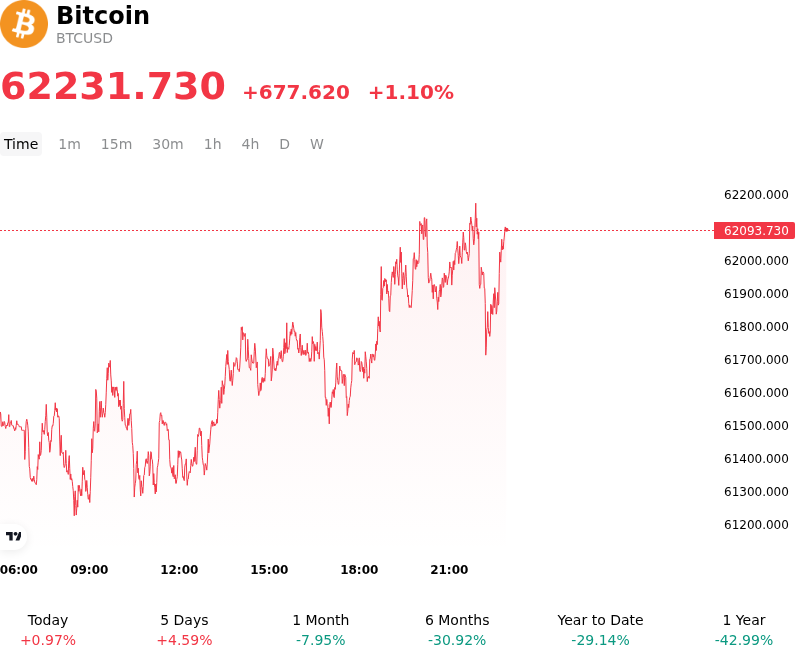
Bitcoin (BTCUSD) is up 1.10% at Jul 3 10:55(ET), now at $62231.73, with a 7-day up of 4.26%.
What is driving Bitcoin (BTCUSD)’s stock price up today?
The primary catalyst driving the intraday advance in the cryptocurrency market was the release of significantly weaker-than-expected U.S. labor market data. The Bureau of Labor Statistics reported that the U.S. economy added only 57,000 jobs in June, coming in at nearly half of the projected consensus of 110,000, alongside downward revisions to previous months. This cooling of the labor market immediately shifted macro liquidity expectations, leading market participants to price in a higher probability of near-term Federal Reserve monetary easing.
This macroeconomic shift acted as a powerful relief valve for risk assets, reducing the yields on U.S. Treasuries and dampening the upward pressure on the U.S. dollar. Because higher interest rates increase the opportunity cost of holding non-yielding digital assets, the sudden drop in rate expectations substantially boosted investor risk appetite. The broader market, which had been characterized by extreme fear following a prolonged summer correction, responded with immediate capital inflows.
The sudden upward momentum triggered a major short squeeze in the derivatives market, compounding the spot price appreciation. Leveraged traders holding bearish positions were caught off guard by the macroeconomic print, leading to approximately $450 million in crypto short liquidations over the 24-hour period. This forced buying of spot assets to cover derivative positions accelerated the upward momentum, pushing the price back above the psychologically vital threshold of $60,000.
Institutional flows also provided a crucial tailwind, signaling a potential stabilization of demand. Following a brutal month of record outflows in June, U.S. spot ETFs reversed their multi-day negative trend to post more than $220 million in positive net inflows. This renewed institutional interest, led by substantial inflows into products like Fidelity's FBTC, helped offset the persistent redemptions that had weighed heavily on market sentiment earlier in the week. Furthermore, large-scale long-term holders, or "whales," resumed net accumulation, absorbing supply and building a supportive price floor.
While the immediate reaction represents a positive structural bounce, institutional investors continue to monitor persistent risks. The broader digital asset market remains sensitive to upcoming inflation prints and the long-term direction of central bank policies. However, the combination of favorable macroeconomic developments, short liquidations, and stabilizing spot ETF demand successfully drove the intraday recovery, shifting market momentum away from the extreme downside risks of the previous weeks.
Technical Analysis of Bitcoin (BTCUSD)
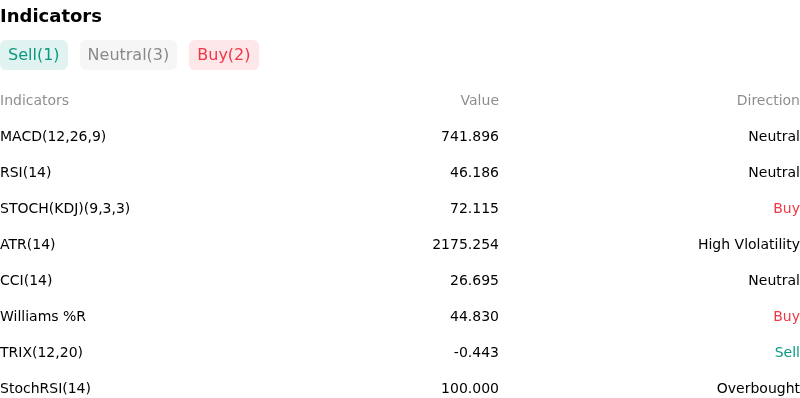
Technically, Bitcoin (BTCUSD) shows a MACD (12,26,9) value of 741.896, indicating a neutral signal. The RSI at 46.186 suggests neutral condition and the Williams %R at 44.830 suggests buy condition. Please monitor closely.
More details about Bitcoin (BTCUSD)
Recent Events and Risks:
- Severe Structural Sell-Off and Net ETF Redemptions: Although spot Bitcoin ETFs experienced a temporary inflow on July 2, 2026, they are emerging from their worst month on record. In June 2026, spot ETFs posted a record $4.5 billion in net outflows, with BlackRock’s iShares Bitcoin Trust (IBIT) driving a significant portion of this capital flight. Furthermore, on July 1, spot funds recorded an additional $294.62 million outflow, demonstrating a severe degradation of the institutional bid that supported the token earlier in the year.
- Bearish Chart Structures and On-Chain Distribution: On the three-day timeframe, Bitcoin has formed a prominent head and shoulders pattern, with technical analysts warning that a sustained drop below the $55,298 Fibonacci support level could trigger a 26% breakdown toward the $42,000 range. Compounding this bearish structure, the Bitcoin exchange whale ratio spiked to a local high of 0.69, indicating that large holders are aggressively depositing assets to exchanges, a trend that historically precedes localized dumps.
- Persistent Loss Realization and Thin Valuation Floors: Bitcoin’s decline to 21-month lows near $58,000 has pushed roughly 10.83 million BTC into unrealized losses. This leaves the asset highly sensitive to a potential collapse in market confidence. Analysts point to the realized price near $53,000 as a key on-chain valuation floor, warning that if the broader psychological support at $58,000 is conclusively broken, it could quickly expose the $50,000 to $53,000 range to rapid downside.
- Divergent Liquidity Rotation and AI Equity Competition: Capital is actively rotating away from Bitcoin, with investors favoring Ethereum ETFs as well as non-crypto risk assets, particularly high-performing artificial intelligence (AI) equities. This capital diversion, coupled with a macro-economic backdrop of sticky interest rates, continues to limit the spot market liquidity required for Bitcoin to stage a sustainable trend reversal.
This article may include AI-generated content that is human-reviewed, which is for reference and general information purposes only and does not constitute investment advice.
Recommended Articles


Comments (0)
Click the $ button, enter the symbol, and select to link a stock, ETF, or other ticker.