

Gold (XAUUSD) Is down 2.02% on Jun 17: What Changed in Supply and Demand?

Gold (XAUUSD) is down 2.02% at Jun 17 15:20(ET), now at $4243.84, with a 7-day up of 4.24%.
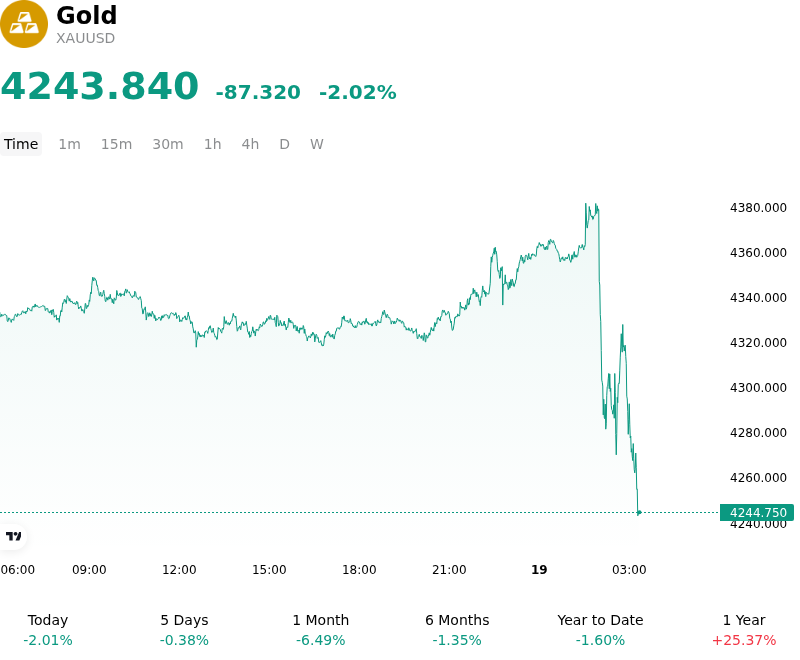
What is driving Gold (XAUUSD)’s stock price down today?
Gold prices faced a sharp selloff, driven by the dual impact of a highly hawkish pivot from the Federal Reserve and a sudden contraction in safe-haven risk premiums. The primary catalyst for the decline was the outcome of the Federal Open Market Committee meeting, which marked the debut of the newly appointed Fed Chair, Kevin Warsh. Although the central bank kept the benchmark interest rate unchanged at 3.50% to 3.75% as widely anticipated, the updated Summary of Economic Projections and the closely watched dot plot delivered a significant hawkish shock to the market.
The updated dot plot revealed a major shift in policymaker expectations, with the median projection indicating that interest rates will end the year higher than previously forecast, effectively erasing the rate cuts projected earlier in the year. Nearly half of the committee members signaled support for potential rate hikes later in the year, pointing to sticky inflation and a highly resilient labor market. Furthermore, the Fed streamlined its policy statement, removing prior language that signaled an easing bias or implied that the next move would be a rate cut. For non-yielding bullion, the prospect of a prolonged period of restrictive monetary policy and elevated real yields dramatically increased the opportunity cost of holding the asset, prompting swift institutional liquidation.
Simultaneously, the geopolitical risk premium that had previously supported gold began to unwind rapidly. Investor optimism grew regarding a tentative diplomatic agreement between the United States and Iran, which is expected to restore critical oil flows and ease tensions in the Middle East. The prospect of a diplomatic resolution triggered a selloff in crude oil, which diminished broader inflation expectations and reduced the immediate demand for safe-haven hedges.
This combination of rising real yield expectations, a firmer US dollar, and deflating geopolitical anxiety triggered a technical breakdown in gold. Bullion broke below key short-term support levels, triggering stop-loss orders and accelerating the downward momentum during the trading session. While structural demand from global central banks remains a supportive long-term trend, the near-term outlook for gold is heavily constrained by the Fed's aggressive focus on price stability and the deferral of the monetary easing cycle.
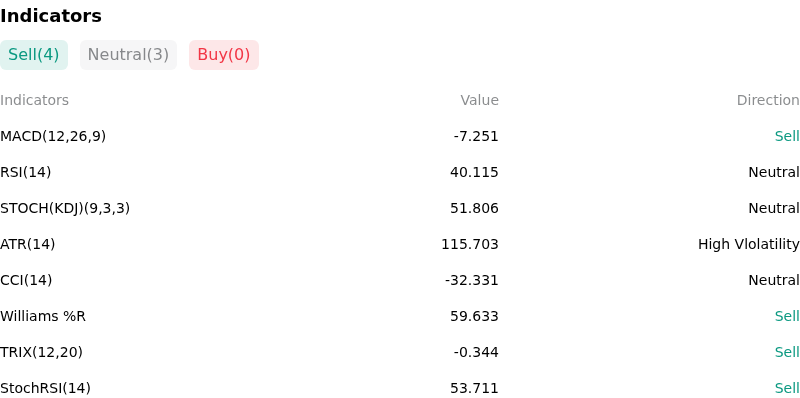
Technical Analysis of Gold (XAUUSD)
Technically, Gold (XAUUSD) shows a MACD (12,26,9) value of -7.251, indicating a sell signal. The RSI at 40.115 suggests neutral condition and the Williams %R at 59.633 suggests sell condition. Please monitor closely.
More details about Gold (XAUUSD)
Recent Events and Risks:
- Federal Reserve Policy and FOMC Event Risk: The FOMC meeting on June 16–17, 2026—marking Kevin Warsh's inaugural press conference as Fed Chair—poses a severe near-term downside risk. While a rate hold is priced in, any hawkish shift in the updated Summary of Economic Projections (dot plot) or restrictive policy guidance could trigger a sharp rise in real yields and the US dollar, potentially forcing a liquidation of gold futures back toward $4,250 and $4,100.
- Deflation of the Geopolitical Risk Premium: Accelerating progress toward a formal US-Iran peace agreement and the reopening of the Strait of Hormuz have pushed global crude oil prices below $80 a barrel. This sudden resolution of the Middle East conflict removes the acute energy-led supply shock, heavily reducing the demand for gold as a hedge against oil-driven inflation.
- Technical Resistance and Bearish Trend Resumption: Despite a recent 2% to 3% short-term recovery off its yearly lows, XAUUSD remains locked in a broader corrective downtrend from its January peak of $5,589. The spot price is currently facing heavy overhead technical resistance at the $4,350 to $4,367 zone. Failure to break above these levels threatens a technical rejection and a retest of the multi-month support floor near $4,024.
- Slowing Institutional and Seasonal Demand: Near-term investment flows into gold have dried to a trickle, prompting major institutions like J.P. Morgan to trim their full-year average price forecasts. This lack of supportive institutional ETF buying coincides with the typical June–July seasonal lull in global jewelry fabrication demand, leaving gold vulnerable to downside volatility in the absence of physical buyers.
This article may include AI-generated content that is human-reviewed, which is for reference and general information purposes only and does not constitute investment advice.
Recommended Articles


Comments (0)
Click the $ button, enter the symbol, and select to link a stock, ETF, or other ticker.