

T-Mobile US Inc Stock (TMUS) Moved Down by 3.36% on Jun 3: Drivers Behind the Movement

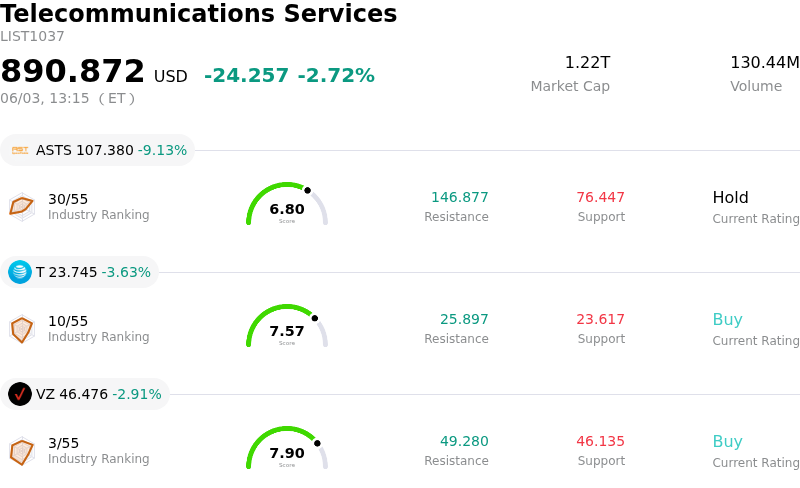
T-Mobile US Inc (TMUS) moved down by 3.36%. The Telecommunications Services sector is down by 2.72%. The company underperformed the industry. Top 3 stocks by turnover in the sector: AST SpaceMobile Inc (ASTS) down 9.13%; AT&T Inc (T) down 3.63%; Verizon Communications Inc (VZ) down 2.91%.
What is driving T-Mobile US Inc (TMUS)’s stock price down today?
T-Mobile US (TMUS) experienced a notable intraday decline, primarily influenced by investor reactions to management commentary delivered at the Evercore Global TMT Conference held on June 2-3, 2026. While no specific new financial guidance or formal earnings announcements were made at the event, the downward movement suggests a "risk-off" response to the tone of discussions, competitive insights, or capital allocation messaging emanating from the conference.
This company-specific catalyst appears to be amplified by broader macroeconomic concerns. Recent data indicated a significant surge in inflation, with the April 2026 Consumer Price Index (CPI) report showing an overall increase driven notably by rising energy costs. This inflationary pressure has led to a repricing of interest rate expectations in financial markets, causing a rise in Treasury yields and fostering uncertainty surrounding the Federal Reserve's future monetary policy. Such an environment often prompts investors to adopt a more cautious stance, particularly towards stocks in capital-intensive sectors like telecommunications.
Despite T-Mobile's strong first-quarter 2026 financial results, which included beating analyst expectations for earnings and revenue, and raising full-year guidance for key metrics like postpaid net account additions and Adjusted Free Cash Flow, underlying industry challenges persist. The telecommunications sector generally faces pressures related to monetization, intense competition, and declining average revenue per user (ARPU), necessitating substantial promotional spending to acquire and retain customers. Concerns regarding the potential for higher promotional activity to impact device-related margins were also noted in the company's recent earnings analysis, which may have been reiterated or emphasized at the conference. The confluence of these factors likely contributed to today's negative stock performance.
Technical Analysis of T-Mobile US Inc (TMUS)
Technically, T-Mobile US Inc (TMUS) shows a MACD (12,26,9) value of [-1.97], indicating a neutral signal. The RSI at 44.77 suggests neutral condition and the Williams %R at -64.51 suggests oversold condition. Please monitor closely.
Media Coverage of T-Mobile US Inc (TMUS)
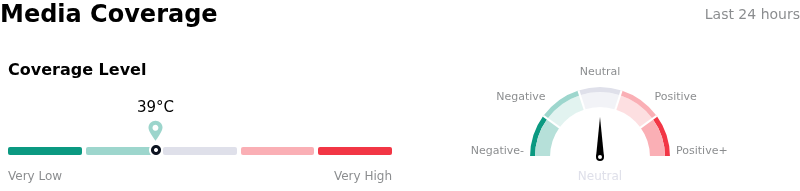
In terms of media coverage, T-Mobile US Inc (TMUS) shows a coverage score of 39, indicating a low level of media attention. The overall market sentiment index is currently in neutral zone.
Fundamental Analysis of T-Mobile US Inc (TMUS)
T-Mobile US Inc (TMUS) is in the Telecommunications Services industry. Its latest annual revenue is $88.31B, ranking 4 in the industry. The net profit is $10.99B, ranking 4 in the industry. Company Profile
Over the past month, multiple analysts have rated the company as Buy, with an average price target of $257.90, a high of $310.00, and a low of $212.00.
More details about T-Mobile US Inc (TMUS)
Company Specific Risks:
- T-Mobile's net income for Q1 2026 experienced a decline attributed to one-time costs associated with the UScellular acquisition, indicating potential ongoing financial impacts from integration activities.
- Continued insider selling by executives, including the Chief Operating Officer and a Director, was reported in late May 2026, which may be interpreted by the market as a lack of confidence or a sign of fully valued stock.
- The company maintains a significant debt-to-equity ratio of 1.58, alongside a quick ratio of 0.97, suggesting a leveraged financial structure that could be vulnerable to adverse changes in interest rates or credit market conditions.
This article may include AI-generated content that is human-reviewed, which is for reference and general information purposes only and does not constitute investment advice.
Recommended Articles


Comments (0)
Click the $ button, enter the symbol, and select to link a stock, ETF, or other ticker.