

ServiceNow Inc Stock (NOW) Moved Down by 7.17% on Jun 2: Key Drivers Unveiled

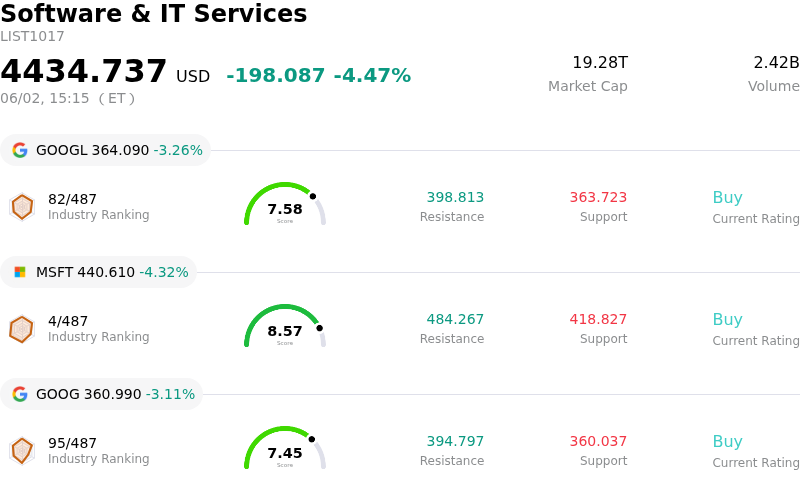
ServiceNow Inc (NOW) moved down by 7.17%. The Software & IT Services sector is down by 4.47%. The company underperformed the industry. Top 3 stocks by turnover in the sector: Alphabet Inc Class A (GOOGL) down 3.26%; Microsoft Corp (MSFT) down 4.32%; Alphabet Inc Class C (GOOG) down 3.11%.
What is driving ServiceNow Inc (NOW)’s stock price down today?
ServiceNow (NOW) experienced a significant intraday decline, primarily driven by a technical correction and profit-taking following a substantial rally in previous trading sessions. The stock had seen considerable gains recently, fueled by the announcement of strong first-quarter 2026 earnings, a notable share buyback program, and positive market sentiment surrounding artificial intelligence in enterprise software, particularly after supportive comments from a prominent industry CEO. This rapid upward movement left the stock in an overextended technical position, making it susceptible to a pullback.
Further contributing to the negative sentiment were renewed concerns about the company's gross margins and the quality of its revenue growth. Recent reports highlighted a year-over-year decline in gross margins, with management forecasting continued compression for subscription gross margin due to increased cloud costs and the ongoing integration of a recent acquisition. While the acquisition contributes to revenue, it is also expected to create near-term headwinds for both operating and free cash flow margins.
Analyst sentiment also played a role in the stock's downward movement. A new "Sell" rating, citing weakening gross margins and growing caution ahead of earnings from major enterprise software rivals, impacted investor perception. Additionally, some analysts had previously lowered price targets, reflecting a re-evaluation of guidance and concerns over organic growth versus acquisition-driven growth. Delays in closing several large on-premise deals in the Middle East during the first quarter also contributed to investor wariness regarding future revenue growth.
The current price action suggests that investors are reassessing how much of the prior positive news was already factored into the stock's valuation, making it more sensitive to any perceived weaknesses or downgrades. This represents a shift from the previous day, when the stock had benefited from broader optimism in the software sector driven by AI integration and strong performance from industry peers.
Technical Analysis of ServiceNow Inc (NOW)
Technically, ServiceNow Inc (NOW) shows a MACD (12,26,9) value of [2.17], indicating a buy signal. The RSI at 78.17 suggests buy condition and the Williams %R at -6.21 suggests oversold condition. Please monitor closely.
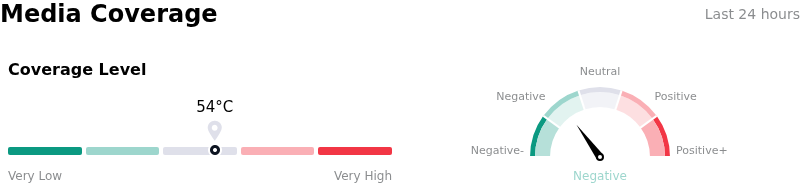
Media Coverage of ServiceNow Inc (NOW)
In terms of media coverage, ServiceNow Inc (NOW) shows a coverage score of 54, indicating a moderate level of media attention. The overall market sentiment index is currently in bearish zone.
Fundamental Analysis of ServiceNow Inc (NOW)
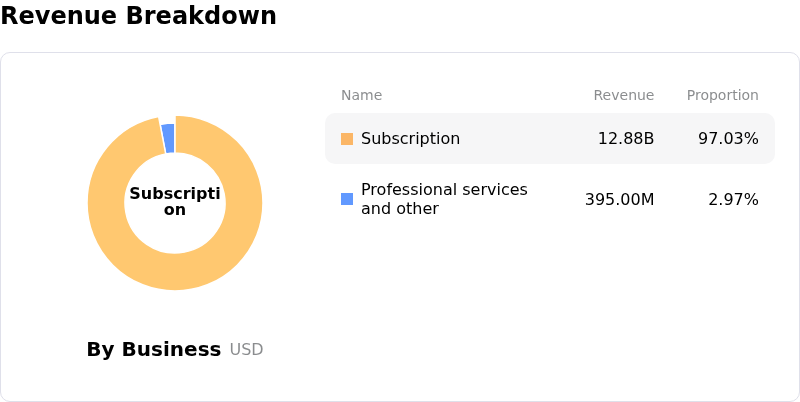
ServiceNow Inc (NOW) is in the Software & IT Services industry. Its latest annual revenue is $13.28B, ranking 28 in the industry. The net profit is $1.75B, ranking 30 in the industry. Company Profile
Over the past month, multiple analysts have rated the company as Buy, with an average price target of $143.92, a high of $236.00, and a low of $85.00.
More details about ServiceNow Inc (NOW)
Company Specific Risks:
- Declining gross margins have been observed, with a year-over-year drop from 78.9% to 75%, and management anticipates further compression due to rising cloud and artificial intelligence (AI) related costs.
- Evidence of weakening pricing power and challenges in customer expansion is indicated by a slipped renewal rate to 97% and flat net-dollar-retention.
- Poor capital allocation is a concern, with significant stock-based compensation necessitating share buybacks funded by a substantial draw down of the company's cash reserves.
- A recent Form 4 filing indicates insider selling, with a company director selling 1,595 shares on May 28, 2026.
This article may include AI-generated content that is human-reviewed, which is for reference and general information purposes only and does not constitute investment advice.
Recommended Articles


Comments (0)
Click the $ button, enter the symbol, and select to link a stock, ETF, or other ticker.