


USD/CHF Price Forecast: Bearish flag holds as bulls eye 0.8150



- USD/CHF snaps four-day rally but holds above 0.8100.
- Bullish RSI turns flat, signaling further sideways trading ahead.
- Break above 0.8150 exposes 0.8207 and 0.8250 next.
The USD/CHF turns negative on the day, snapping a four-day winning streak, yet it remains above 0.8100, suggesting further upside is possible if buyers reclaim key resistance levels. At the time of writing, the pair trades at a 0.12% loss.
USD/CHF Price Forecast: Technical Outlook
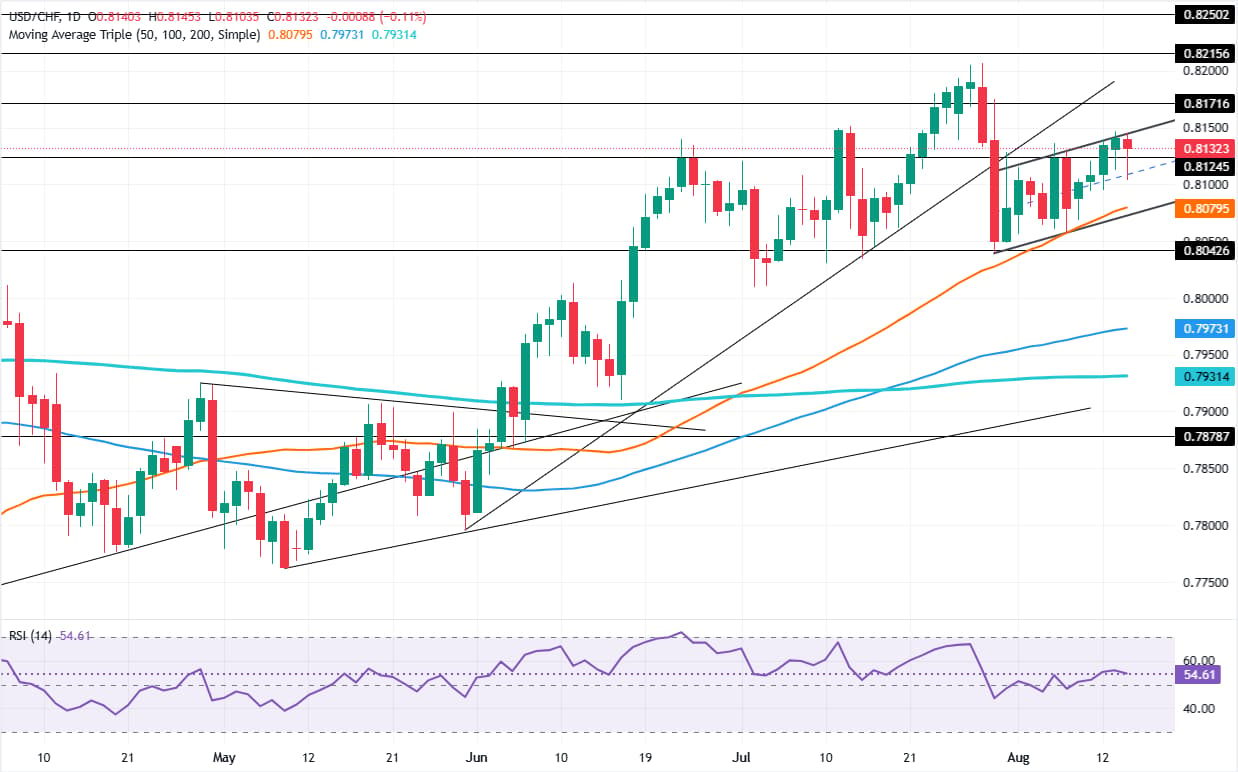
The ‘bearish flag’ remains in play. Although the pair refreshed a two-day low, closing Friday’s session near the week's highs, it could open the door to a breakout to the upside and a resumption of the uptrend.
The Relative Strength Index (RSI) is bullish but has turned flat, suggesting additional sideways trading lies ahead.
If USD/CHF breaks above 0.8150, the next area of interest would be the July 29 high at 0.8207. Once surpassed the next stop is the June 19, 2925 high at 0.8215, followed by the June 4, 2025 peak at 0.8250. Up next is 0.8300.
Downwards, the first support for USD/CHF is the low of the day (LOD) at 0.8103, which opens the path for a move lower to the 50-day Simple Moving Average (SMA) at 0.8079. The next support level would be the July 30 swing low of 0.8035, ahead of 0.8000.
USD/CHF Price Char – Daily
Euro Price Today
The table below shows the percentage change of Euro (EUR) against listed major currencies today. Euro was the strongest against the US Dollar.
| USD | EUR | GBP | JPY | CAD | AUD | NZD | CHF | |
|---|---|---|---|---|---|---|---|---|
| USD | -0.30% | -0.33% | -0.10% | -0.38% | -0.28% | -0.57% | -0.13% | |
| EUR | 0.30% | -0.03% | 0.20% | -0.11% | 0.02% | -0.27% | 0.17% | |
| GBP | 0.33% | 0.03% | 0.24% | -0.08% | 0.05% | -0.23% | 0.21% | |
| JPY | 0.10% | -0.20% | -0.24% | -0.28% | -0.20% | -0.51% | -0.03% | |
| CAD | 0.38% | 0.11% | 0.08% | 0.28% | 0.09% | -0.19% | 0.26% | |
| AUD | 0.28% | -0.02% | -0.05% | 0.20% | -0.09% | -0.29% | 0.17% | |
| NZD | 0.57% | 0.27% | 0.23% | 0.51% | 0.19% | 0.29% | 0.47% | |
| CHF | 0.13% | -0.17% | -0.21% | 0.03% | -0.26% | -0.17% | -0.47% |
The heat map shows percentage changes of major currencies against each other. The base currency is picked from the left column, while the quote currency is picked from the top row. For example, if you pick the Euro from the left column and move along the horizontal line to the US Dollar, the percentage change displayed in the box will represent EUR (base)/USD (quote).
Recommended Articles








Comments (0)
Click the $ button, enter the symbol, and select to link a stock, ETF, or other ticker.